The spectroscope is an instrument that separates white or near-white light into constituent colored bands as in a rainbow. The spectra can be projected onto a screen, viewed through a lens assembly, or photographed. The most elementary spectroscopes consisted of a single prism as used by Isaac Newton, described in an early treatise. He caused sunlight, passing through a small opening and glass prism, to be projected on a screen. The prism refracted (that is, changed the direction of light because it has entered a medium with a different density from the one through which it has been traveling) the beam into a spectrum. The spectrum resulted because different wavelengths refract by different amounts due to dispersion. This image was then viewed through a tube with a scale that was transposed upon the spectral image, enabling its direct measurement. Thus, Newton demonstrated that white light is a mixture of distinct colors corresponding to energy states of particles or frequencies of electromagnetic waves. Adding a second, inverted prism, re-assembled the spectrum to form white light.
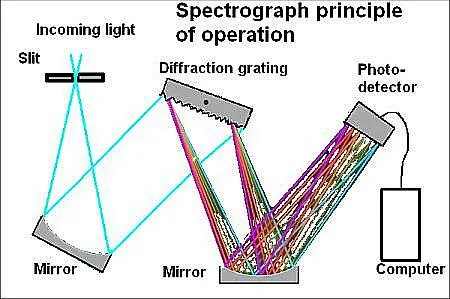 In later spectroscopes, the prism was replaced with one or more diffraction gratings consisting of engraved glass or slits in a thin opaque plate. The spaces between the slits or lines must be wider than the wavelength of the light so for diffraction to occur. Each slit in the grating upon which a perpendicular beam of light falls becomes a point-source. After passing through, the light propagates at angles limited by the orientation of the diffraction grating.
Various elements and compounds, when heated, produce narrow bands at distinct frequencies within the light spectrum. A spectroscope in conjunction with a large-aperture telescope can display bright emission lines, revealing the chemical composition of distant stars. Similarly, dark absorption lines correspond to constituent elements in intervening cold dust and gas clouds. The spectral signatures of these substances are identified by heating them in a laboratory and using a bench-mounted spectroscope to match up the substances with characteristic emission lines.
The difference between a spectroscope and a spectrograph is the spectrograph employs the same principle as the spectroscope but has a camera in place of the viewing tube. In recent years, the electronic circuits built around the photomultiplier tube have replaced the camera, allowing real-time spectrographic analysis. Arrays of photosensors are also used in place of film in spectrographic systems. The exact choice of detector depends on the wavelengths of light to be recorded. Such spectral analysis, or spectroscopy, has become an important scientific tool for analyzing the composition of unknown material and for studying astronomical phenomena and testing astronomical theories.
In modern spectrographs in the ultraviolet, visible, and near-infrared spectral ranges, the spectrum is generally given in the form of photon number per unit wavelength (nm or μm), wavenumber (μm−1, cm−1), frequency (THz), or energy (eV). In the mid- to far-IR, spectra are typically expressed in units of Watts/unit wavelength (μm) or wavenumber (cm−1).
There are several kinds of machines referred to as spectrographs, depending on the precise nature of the waves. Monochromators have one exit slit, and one wavelength at a time can pass through that slit. Polychromators have multiple exit slits, each of which allows a different wavelength to pass through. A detector sits behind each slit so each detector measures light at a different wavelength.
Polychromators are commonly used to observe several discrete wavelengths, leaving gaps in-between. Monochromators and polychromators differ from ordinary spectrographs in that spectrographs generally do not make use of exit slits. Instead, they use a single spatially selective detector (such as photographic film or a CCD). And spectrographs are generally used to observe a continuous range of wavelengths, not the selective wavelengths recorded by polychromators and monochromators.
