Special Challenges of Military Displays
Military displays are used in harsh environments and must meet rigorous operating and non-operating standards. Elements of the display, such as circuit boards, have their own procurement difficulties. While power supplies and single board computers that meet all performance requirements are relatively easy to identify, the choice is more limited for commercial off-the-shelf (COTS) LCD controllers, which typically receive the external video signal, perform video processing, and drive the LCD panel.
It is difficult to find source controllers that will meet the wide range of shock, vibration, temperature, humidity, and altitude requirements. Secondly, special video processing functions, such as programmable line width and anti-aliasing, are not generally offered in COTS controllers. Lastly, controllers that accommodate less common signals may not be available at all. One example is a display that receives both raster and stroke signals multiplexed onto the same signal path.
A raster only interface could take advantage of a COTS LCD controller that automatically handles many video interface standards, but the stroke and combined raster/stroke modes create additional requirements that are not as simple to meet as synchronizing and digitizing scan lines. These include stroke/raster registration for accurate symbol placement, a black border around the stroked graphic items for easier identification, and the aforementioned line width control and anti-aliasing.
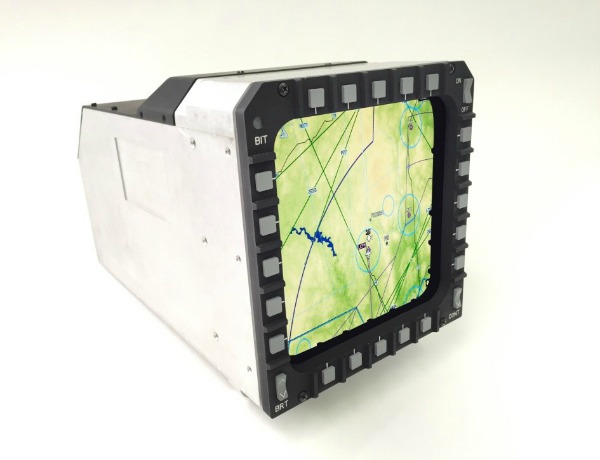
These constraints call for a custom video conversion and control function replacement for the analog CRT digital counterparts. One company faced just such a challenge in designing a new 6×6 Multi-Function Display (MFD) for a CRT replacement (see Figure 1).
A Custom LCD Controller
A field-programmable gate array (FPGA) is the ideal central component for custom video processing and control applications due to its power, flexibility, processing performance versus software solution, and wide array of available Intellectual Property (IP) cores. Additional functions must be included in the design to accomplish a fully featured LCD controller, such as a Display Data Channel (DDC) interface and on-screen display menu, which are general-purpose display controls. This design challenge centers around a special application with a heavy emphasis on the raster/stroke conversion.
FPGA Configuration for Raster/Stroke Video Conversion
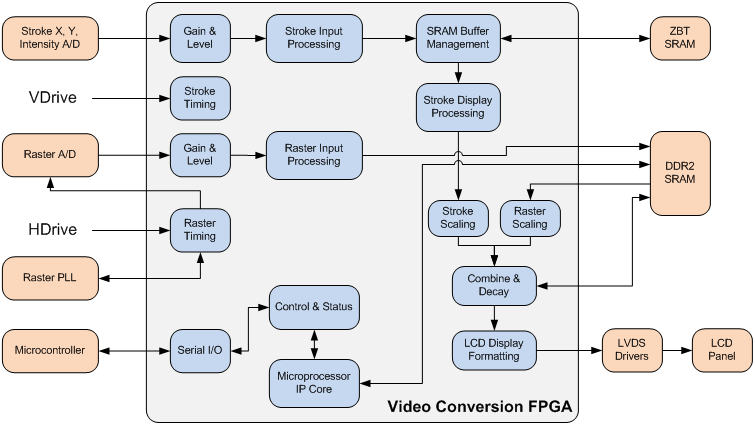
The following describes the basic operation of a raster/stroke interface mode. A block diagram for this conversion is shown below in Figure 2. The stroke input processing function receives the X & Y deflection and stroke intensity signals from an A/D converter and processes them for gain, filtering, oversampling, Gaussian spot processing, and scaling.
The raster input processing function receives the RS-170 and RS-343 signals that have also been sampled. The resulting data is processed for gain, gamma correction, and scaling.
The converted stroke and raster data is flattened to a single layer, processed for phosphor decay and output as 24-bit RGB. Note that many CRT replacements are required to emulate the phosphor performance of the legacy display. This allows the replacement to be truly backwards-compatible while benefiting from high-resolution AMLCD technology.
Built-in tests include SRAM and SDRAM pattern tests, deflection, stroke intensity, raster A/D interface test, LCD I/F status check, HDRIVE & VDRIVE period checks, and a visual BIT display pattern.
While this signal type is unique for this particular application, the FPGA configuration has many elements that can carry forward to other designs.
Flexibility, Cost, and Lifecycle Benefits
Developing a custom LCD controller provides several immediate benefits. The FPGA and support components can be sized for only the necessary functions, which can reduce size, weight, power, and cost (SWAP-C). This also wards against cybersecurity, which has gained considerable attention, by controlling the pedigree of a major logic-bearing component. The hardware can be placed and routed on a circuit board outline that can better meet the requirements of mounting, cooling, harness routing, and maintainability. In many cases, this can reduce costs and increase reliability by eliminating the need for the LCD controller to be a separate circuit board, as the video processing and LCD control can be co-located with the microcontroller, which handles basic functions like backlight intensity and bezel button actuation.
The resulting in-house development of the LCD controller function provides a point of departure for more flexible and complete solutions in future products at only a delta cost. Features can be added and removed as necessary. In this example, common digital video inputs may be included as build options, and a DDC interface may be used to automatically configure the output characteristics to drive different LCD panels. FPGAs can be selected at different price points for higher speed interfaces or more complex functions but also for lower cost feature sets used in other highly specific applications. IP cores, such as microprocessors and DSPs, extend the capabilities far beyond those of traditional FPGA logic. As the library of video processing function grows, the value of the IP is realized again and again. As newer and more capable FPGAs are introduced, the existing code can be ported to take advantage of speed, power or cost improvements.
Summary
CRT form, fit, and function interface (F3I) LCD replacement is expected to continue due to ongoing military budget constraints that result in service life extension rather than total replacement. When the legacy replacement calls for the development of an in-house LCD controller, the developer should embrace the challenge and work to reap the benefits of reuse and add to the organization’s intellectual property portfolio.
FPGA video processing forms the basis for legacy CRT replacement and provides the IP for low-cost variants. Coupled with the appropriate front end (analog, DVI, etc.), this approach can result in a full-featured, integrated video processing capability embedded within existing display hardware without the need for a separate LCD controller. The ensuing design provides flexibility to address future customized applications and offers a range of cost and lifecycle benefits.
Raster/Stroke Signal Characteristics (Sidebar)
Most legacy CRTs use either a raster or stroke video input, and some can switch between modes, or even use both at once. Most engineers are familiar with these increasingly rare signals.
Monochrome raster video uses a constantly moving electron beam for which the X-Y target location on the display surface is always known. The beam moves horizontally from one edge to the other (raster line) and then moves quickly back to the next starting position (horizontal retrace). When the beam gets to the last position, it moves quickly back to the upper starting position (vertical retrace). Depending on the system the beam either paints every line or every other line. During the raster line periods the intensity of the beam determines the brightness, and in many cases, color, of the display at that point. Regardless of the intensity, starting location, raster and retrace timing, and interlaced or progressive scanning, the beam is always moving.
Monochrome stroke video does not use the horizontal and vertical line and retrace signals, but instead controls the X and Y location, and beam intensity, with separate signals. This allows the control circuit to essentially write to any part of the display at any time. Common examples include oscilloscopes and radar/IFF Plan Position Indicators (PPI).
The vertical refresh interval of the raster signal is relatively long, and some legacy displays take advantage of part of the vertical retrace blanking time to allow stroke signals to control the electron beam. This hybrid approach allows the use of stroke graphics overlaid on the raster picture and is typically used for amplifying information overlays such as symbols and text.
The notional timing diagram for a Raster/Stroke mode is shown below in Figure 3. In this example the X and Y deflection, gated by the Stroke Intensity, paint a box shaped object.