The cost of undertaking multi-domain debugging has come down. New instrumentation can time-correlate RF and embedded signals to let designers quickly uncover the root causes of knotty problems.
CHRIS ARMSTRONG, RIGOL TECHNOLOGIES INC.
Examine a typical device that is part of the Internet of Things and you’ll likely find a product that combines RF, digital, and analog design elements. Ultimately, developers of such products must interactively debug systems that include both RF and embedded subsystems. Design issues can be seen in embedded signals, RF signals, or radiated emissions while the root cause of the issues may reside in any of those sections or in the mechanical design.
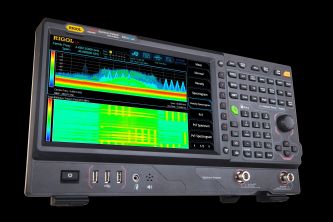
The Rigol Real-Time Spectrum Analyzer (RSA5000).
To address such complex debugging issues, it is useful to employ both real-time spectrum analysis and high-performance oscilloscopes. Recently developed instruments combine these facilities to simplify the task of multi-domain analysis: sizing up digital, analog, and RF signals that characterize IoT devices.
A case in point is the Rigol RSA (real-time spectrum analyzer) series. Unlike many basic real-time spectrum analyzers, these instruments combine hardware triggering and IF output in a way calculated to help in advanced multi-domain analysis.
The identification of most issues in troubleshooting starts with the capture and verification of signals either in the time domain or RF domain. One of the advantages of instruments that combine real-time spectrum analysis with scope displays is that the operator can view signals over time or in the form of a frequency spectrum. When symptoms appear in the RF transmissions, operators can monitor the frequency band of interest to investigate transient events. Operators can extend this analysis into the time domain by either looking at a power-vs-time view or by monitoring the IF signal on the scope. Deep memory and waveform recording verify signals as they change otimescalesme scales.
It is useful to examine the new RF domain views available in real-time analysis. As a debugging tool, Rigol’s RSA enables viewing time in three distinct modes. One of the most important is the density view. The density view color-codes the probability of occurrence to highlight transient signals that are difficult to capture using other techniques. Density view makes it possible to see signals obscured by the spectrum of some other signal. With frequency on the X axis and power on the Y axis, color coding shows how often a frequency of interest reaches a particular power level. Yellow and red signify more frequent visits, and bluer hues for signal levels that are more rare.

Density view of a hidden signal artifact.
The second mode displays a spectrogram history of power across the spectrum. The spectrogram shows the sequencing of signals over longer time periods. A typical task where spectrogram history comes in handy is in the characterization of a hopping FSK-modulated signal. The spectrogram helps identify the hopping algorithm and channel spacing over time. Markers can be used on the spectrogram display to calculate the timing between transmissions.
Transient events like a hopping signal can be further characterized through use of the third mode, the power vs. time display. It shows the timing of power changes from microseconds to seconds.
CORRELATION
It is often necessary to correlate embedded signals or serial data packets with RF signals to find the root cause of a bug. There are three ways the RSA and an oscilloscope can be used together to correlate these signals.

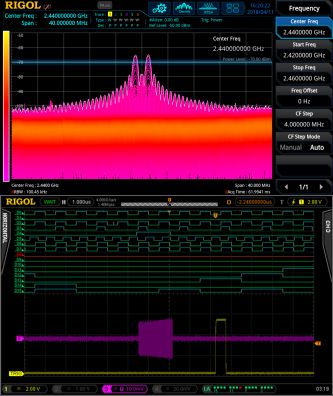
RSA can display both signal density and a spectrogram view simultaneously. Here the signal depicted is a hopping FSK modulated signal. The second screen shot shows the same signal with the addition of the power vs. time display in the top right. The signal’s 1-msec repetition rate becomes clear in this view. The spectrogram shows the same hopping sequence and the spectrum in the bottom panel shows the latest capture of the FSK pulse. This capture triggers when it detects a power level of at least -60 dBm. Individual pulses in this example are too short to measure. To zoom in on this pulse width, the operator would connect the scope to the IF output of the RSA. This tactic makes it possible to view the precise timing of the RF pulse and see it in context of other signals.
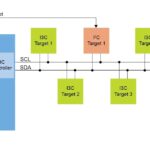
All three methods use the same connections. The RSA trigger-out connects to the scope external input or one of the standard channels. The oscilloscope trigger output connects to the RSA trigger input. Finally, an RSA output called the IF output connects to a 500-MHz scope channel in 50-Ω mode. (The IF output reproduces the RSA’s real-time bandwidth on a 430-MHz carrier, making the data accessible on a 500 MHz scope.)

Three different triggering and display connection schemes can help implement multi-domain debugging on an RSA and mixed-signal scope: The RSA trigger-out connects to either the scope external input or a standard channel. Alternatively, the scope trigger output connects to the RSA trigger input. Finally, the RSA IF output connects to a 500-MHz scope channel in 50-Ω mode.
With the connections in place, the instruments can be set to trigger together in three different ways. The first method involves triggering on the oscilloscope itself. With the RSA in real-time mode, you can select a view and trigger on the scope channel connected to the RSA IF output. The scope can be set to trigger on RF power changes. Operators can correlate these changes with the other signals the scope captures. This triggering method can select a trigger signal from any embedded signals on the mixed-signal oscilloscope or from the IF output channel.
The second method facilitates a detailed analysis by ensuring both instruments pause together. Here we trigger the RSA from the scope’s trigger output. Whenever the scope identifies a trigger event, the RSA will also trigger, and displays on both instruments will correlate. The FFT math function on the oscilloscope can display the spectrum in this mode. This method works well for viewing signals containing complex time-correlated events as well as RF signal patterns that are best viewed on the analyzer as well.
For more complex RF signals, the third triggering method comes into play. It takes advantage of the RSA real-time capabilities to trigger on the power level or specific values within the spectrum. Here we set the RSA trigger mode to Power or Frequency Mask Trigger. The RSA’s trigger-out signal then triggers the scope. This setup lets the operator view the status of embedded, power, and serial signals at the time of a RF event or EMI emission.
Having investigated potential bugs and correlated signals across the relevant sections of our device we can now analyze changes and improvements to solve the problem.
ANALYSIS
With a deep memory scope like the 4000 Series, the long record length can help view the time before and after an RF event to find the root cause of any errors. This time-based analysis is critical because many causes of problems are not instantaneous but result from a previous event. Programmable components like FPGAs hide many of these errors. One way to debug and verify their performance is to monitor changes over time continuously to locate the logic or state error.
The power trigger being used to capture an FSK pulse on an RSA. The resulting pulse and trigger appears on the scope . In this mode, both instruments will trigger together only when power is detected in the 2.4-GHz band at or above -70 dBm.
Rigol’s waveform-record mode is another tool for multi-domain analysis. Record mode makes it possible to capture a sequence of thousands of trigger events, then play back captured data using pass/fail masks or a point-by-point RMS difference analysis. The resulting data helps compare error occurrences and find a common cause.

A screen caption from a 4000-Series scope shows the IF pulse (in purple) as well as the RSA trigger (in yellow) near the bottom of the main display. Here we have detected errant pulses in the two FSK series and have located the related embedded signal that is the root cause. In record mode, correlation between the blue trace (named D4) and RF power (in purple) becomes evident. Once these issues are rectified, the RSA helps compare the realized modulation scheme to the design specifications. The RSA includes a 2FSK signal analysis package that aids in this evaluation. The 2FSK mode in the analyzer helps characterize each channel level and frequency to ensure it is within the error budget. The screen grab shows the results of the analysis on the improved hopping FSK signal.
All in all, an RSA combined with a 500-MHz mixed-signal oscilloscope bridges the gap between RF and embedded signals making true multi-domain analysis possible. This multi-domain analysis comes at significant savings to a single, new instrument with multi-domain capabilities that would typically cost $20,000 – but provide a more limited ability to visualize complex RF signals in real-time.
References
Rigol Technologies, Inc., RSA details
Multi-Domain Debugging and Analysis


Leave a Reply
You must be logged in to post a comment.