Lissajous figures merge mathematical elegance, engineering applications, and artistic possibilities.
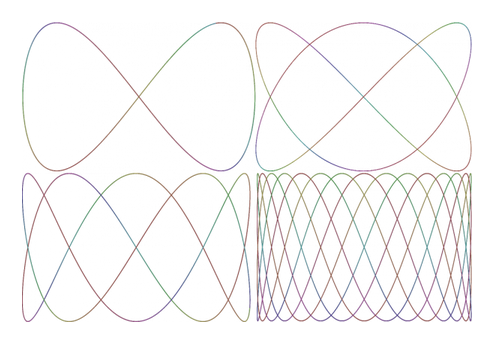
Lissajous figures (or curves): even if you don’t know what that name refers to, you have very likely seen them and perhaps even been fascinated by them (Figure 1). They are often used as a background image on an oscilloscope screen in science and science-fiction scenes in TV shows and moves since they are evocative of “technology” and are also generally pleasing and interesting to look at (even more so than a plain sine wave).
This three-part article will look at their mathematical background and history, their former widespread use in test and measurement, and artistic efforts which make use of them.
Start with the math
A Lissajous (liss-AH-jou) figure or graph is defined by a pair of parametric equations (with the parameter being “t” usually representing time). These two equations define the plotted position on the X (horizontal) axis and Y (vertical) axis:
X(t) = cos (ω1t – α) and Y(t) = cos (ω2t – β)
where ω1 and ω2 are the frequencies and α and β are phase shifts, expressed in degrees or, more often, in radians.
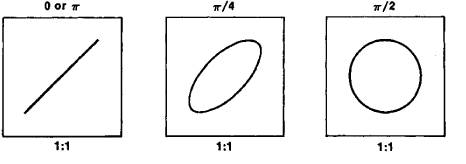
In the simplest case, the two frequencies are the same with no phase shift; the resultant figure is a line at 45⁰ (Figure 2 left). If the relative phase shifts are 90⁰ (π/2 radians), the resultant figure is a simple, pure circle (Figure 2 right). If there is a phase difference other than 90⁰, the circle will become an ellipse (Figure 2 middle). While the resultant circular Lissajous figure may not be especially interesting, it is very important in test and measurement applications, as we will see in part 2.
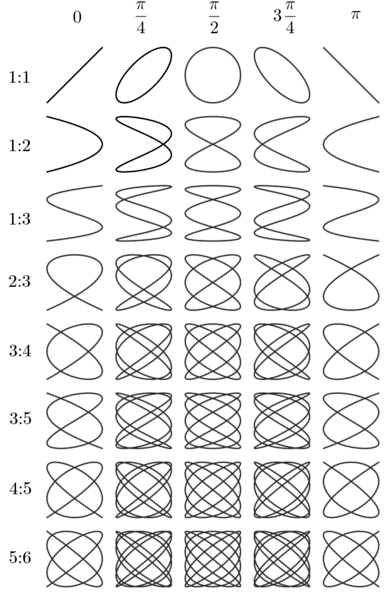
If the ratio of the frequencies is rational, the curve will eventually close. If it is irrational, the curve will never repeat and thus never close, and it will eventually fill a region. As the frequencies or phases cage, the figure will not be static but will rotate and move. By using different ratios of frequencies, different Lissajous figures will be graphed. Figure 3 shows just a few examples of the results of different frequency ratios and phase differences.
While it is possible to graph these equations on a piece of paper manually – and that was how they were initially studied – it’s much more dramatic and flexible now to use function generators, with one connected the X-axis of an oscilloscope and the other to the Y-axis. This allows for dramatically showing the effect of changing frequency and phase (if the function generator supports that latter option).
Of course, it is also possible to use mathematical application packages on a personal computer and write a few lines of basic code to create the waveforms and display them. This is a convenient and low-cost way of creating and displaying these Lissajous figures in both static and dynamic modes and is especially useful for educational purposes.
Lissajous figure history
Although the “exposure” of most people to Lissajous figures is via the function generator and oscilloscope approach, or the math appreciation and some code on a PC, it wasn’t always that way, of course. Nathaniel Bowditch initially investigated the family of Lissajous figure curves in 1815. Later in much more detail and application in 1857 by Jules Antoine Lissajous (for whom they are named), a professor of mathematics at the Lycée Saint-Louis in Paris. Lissajous was studying optical methods of analyzing acoustic vibrations. His technical paper on his optical method of studying vibration is called out in the “History of Information” reference cited at the end, along with images of some of its pages.
In those pre-electronic days, mathematicians and scientists were very clever at using what they had available to investigate natural phenomena techniques of the day. Among the most common techniques were the use of small mirrors suspend on threads, tuning forks, or springs, as the harmonic motion of the arrangement was a sinusoid. They directed beams of light (not lasers, of course) at the mirrors and the reflection onto a flat surface as it traced out the waveform.
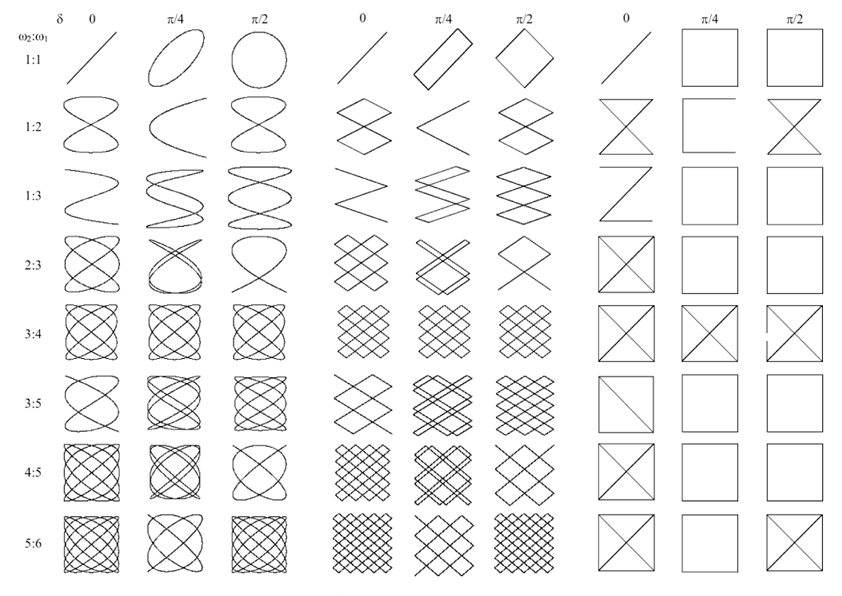
Note that the X and Y inputs do not have to be sinusoids; triangle waves and square waves can be used (Figure 4).
Due to their mathematical nature, Lissajous figures have been analyzed extensively as basic equations and their associated advanced functions such as Chebyshev polynomials. However, to this point, Lissajous figures have been a natural “curiosity” creating interesting and pleasing images but no practical use. Part 2 looks at their role in electronic test and measurement.
WTWH Related Content
- Lissajous patterns: using a scope for display signals
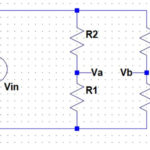
- Wheatstone bridge, Part 1: Principles and basic applications
- Wheatstone bridge, Part 2: Additional considerations
References with software or interaction (and more)
- Jed Margolin, “Lissajous Figures”
- Wolfram Demonstration Projects, “Damped 2D Lissajous Figures”
- Wolfram Demonstration Projects, “Lissajous Figures”
- Datagenetics, “Lissajous Curves”
- Emory University, “Lissajous Figures”
- Interactive Mathematics, “Lissajous Figures”
- com, “Lissajous Lab”
- Analog Devices, “Activity: The Lissajous pattern, A Classic phase measurement”
Other References
- Wikipedia, “Lissajous Curve”
- Electronics Club, “Lissajous Figures or Lissajous Patterns”
- Wolfram Research, “Lissajous Curve”
- Fine Art America, “Lissajous Figure Art”
- MIT, “Lincoln Laboratory Logo”
- History of Information, “Jules Antoine Lissajous Describes Lissajous Figures”
- History of Information, “Figures from Lissajous’s original publication”
- University of Texas, “Lissajous Figures”
- Tutorials Point, “Lissajous Figures”
- National Magnet Lab: Magnet Academy, “Lissajous Figures on an Oscilloscope”
- Science Direct, “Revisiting the Lissajous figure as a tool to study bistable perception”
- PLOS One, “Perceptual Stability of the Lissajous Figure Is Modulated by the Speed of Illusory Rotation”
- SciELO – Scientific Electronic Library Online, “Lissajous-like figures with triangular and square waves”
- EEE Guide, “Frequency Measurement by Lissajous Method”
- All About Circuits, “What Is a Linear System?”
- All About Circuits, “Frequency and Phase Measurement”
- Wikipedia, “Harmonograph”
- Wikipedia, “Australian Broadcasting Corporation”


Leave a Reply
You must be logged in to post a comment.