The Lissajous figures of Part 1 were interesting but of little apparent practical use, but that is not the case. Until the availability of high-accuracy instrumentation for frequency measurement, Lissajous figures served a major role in frequency measurement and assessment.
How so? Today, if you want to measure the resonant frequency of a crystal used to set a radio’s operating frequency, you put it into a suitable oscillator circuit and connect a frequency counter. Even a high-resolution reading to five, six, or more digits is available in counters available for anywhere from a few hundred dollars to several thousand.
But such instrumentation was available at any price. The most common way to check the value of an unknown component such as resistance, capacitance, or crystal/oscillator frequency was to compare it to a known, better standard. For frequency, this meant comparing the output of a known “master” using two oscillators: one with the known crystal in the oscilloscope X channel and the other unknown one in the Y channel (Figure 1). If they were the same, there would be a single, steady circle or ellipse (the ellipse meant there was phase difference, which is of no interest here.).

The master/unit-under-test relationship does not have to be 1:1. As long as the relationship ratio is a rational number such as 3:2, 4:5, 2:1, basic math will allow determining the unknown frequency by counting the number to “lobes” on the horizontal and vertical sides and using a simple formula:
Vertical frequency/horizontal frequency =
number of horizontal lobes/number of vertical lobes
This may seem awkward to us, but at the time, there was no alternative, as frequency meters as we know them did not exist. If the crystal under test was oscillating at too low a frequency, a tiny bit of material would be removed to increase its natural resonance (it’s a real skill), and it would be tested again. If it was too high, a tiny bit of material could be added to the surface to lower its resonance, or the crystal could be put aside for another project.
It may be hard to appreciate the role of crystals for channel selection in tunable systems, given the ease with which we now tune and jump from channel to channel. The reason for this is that we now have synthesized tuning, where a single master crystal can be used to generate all needed frequencies via a digital selection. However, before the availability of such synthesizers, a radio would need a crystal for each channel of interest (unless less precise inductor/capacitor tuning was used. A Citizen’s Band (CB), police, or scanner radio might easily have tens of crystals, with one (or a pair, for full-duplex transmit receiver) for each channel of interest (Figure 2).

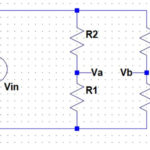
Note that the use of comparisons and nulling to assess crystal frequency is part of a long tradition of null detection for measurement. In the “old” days, the only way to measure most components was by comparing the one under test to a known master and balancing the two, so there was a null between them. Null detection to determine that two items are equal was much more sensitive and accurate than measuring an actual absolute value. This is the operating rationale for the nulling galvanometer, which balances two currents as well as the Wheatstone bridge, which is used to compare ratios and provide a null readout when the ratios are equal (Figure 3).

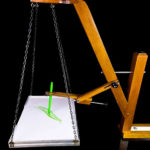
User of a nulling mistuning is analogous to using a beam-balance scale which reads out weight in pounds or kilograms, versus a balance scale which weighs the unknown versus the known, (Figure 4). Such scales and other nulling measurements are still used for many highest-precision calibrations. For the highest-precision assessment at standards organizations such as the National Bureau of Standards and Technology (NIST), a secondary standard is often calibrated for accuracy of its weight, resistance, or capacitance by comparison and nulling to a NIST primary standard.

The idea of using Lissajous figures to null and assess a crystal under test against a known standard may seem archaic. Still, it was very viable and successful for checking and grinding crystals until the advent of high-performance frequency meters. Even today, Lissajous figures can be used to observe the behavior and performance of a crystal or oscillator with respect to changes in temperature, load, orientation (they actually are very slightly sensitive to gravity), package physical stress, impact, and other factors. While this doesn’t provide quantitative data, it does provide a way to get a “big picture” overview of the performance.
In addition to being used to check on frequency, Lissajous figures can also assess the phase difference between two sinusoidal signals. Although such differences can be measured numerically, the Lissajous figure makes it easy to do a visual real-time observation of the phase relationship and subtle changes in it between the left and right channels of a stereo audio signal, for example, to see what factors may be affecting this relationship, and to what extent – and do so as they occur.
Another use of Lissajous figures is with linear systems where, by definition, the output frequency is the same as the input frequency, although the phase and amplitude may change. By connecting the signal at the input of the linear channel to the scope’s X-input and the output to the Y-input, the static input/output phase and amplitude relationship are visible. Any changes will be seen as well.
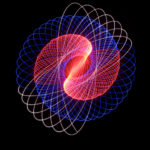
Although the technical role of Lissajous figures has diminished, they are also an intriguing tool for art and graphics. Part 3 will look at that aspect.
WTWH Related Content
- Lissajous patterns: using a scope for display signals
- Wheatstone bridge, Part 1: Principles and basic applications
- Wheatstone bridge, Part 2: Additional considerations
References with software or interaction (and more)
- Jed Margolin, “Lissajous Figures”
- Wolfram Demonstration Projects, “Damped 2D Lissajous Figures”
- Wolfram Demonstration Projects, “Lissajous Figures”
- Datagenetics, “Lissajous Curves”
- Emory University, “Lissajous Figures”
- Interactive Mathematics, “Lissajous Figures”
- com, “Lissajous Lab”
- Analog Devices, “Activity: The Lissajous pattern, A Classic phase measurement”
Other References
- Wikipedia, “Lissajous Curve”
- Electronics Club, “Lissajous Figures or Lissajous Patterns”
- Wolfram Research, “Lissajous Curve”
- Fine Art America, “Lissajous Figure Art”
- MIT, “Lincoln Laboratory Logo”
- History of Information, “Jules Antoine Lissajous Describes Lissajous Figures”
- History of Information, “Figures from Lissajous’s original publication”
- University of Texas, “Lissajous Figures”
- Tutorials Point, “Lissajous Figures”
- National Magnet Lab: Magnet Academy, “Lissajous Figures on an Oscilloscope”
- Science Direct, “Revisiting the Lissajous figure as a tool to study bistable perception”
- PLOS One, “Perceptual Stability of the Lissajous Figure Is Modulated by the Speed of Illusory Rotation”
- SciELO – Scientific Electronic Library Online, “Lissajous-like figures with triangular and square waves”
- EEE Guide, “Frequency Measurement by Lissajous Method”
- All About Circuits, “What Is a Linear System?”
- All About Circuits, “Frequency and Phase Measurement”
- Wikipedia, “Harmonograph”
- Wikipedia, “Australian Broadcasting Corporation”


Leave a Reply
You must be logged in to post a comment.