Vibration is an important design consideration in many electronic applications such as industrial, automotive, aerospace and marine systems, and consumer white goods and disc drives. Even electronic devices designed for use in relatively vibration-free environments can be subjected to potentially damaging vibration during shipment. The concepts related to vibration also find utility in computer graphics, gaming, and animation including virtual and augmented realities (VR/AR). This FAQ reviews the basic concepts of periodic versus random vibration, looks at various methods for measuring vibration and how spectral density functions and probability density functions can be used to characterize vibration.
Vibration is the movement or mechanical oscillation of an object about an equilibrium position. It can be periodic or random and can be expressed in metric units (m/s2) or units of the gravitational constant ‘g,’ where 1 g = 9.81 m/s2. An object can experience free vibration or forced vibration.
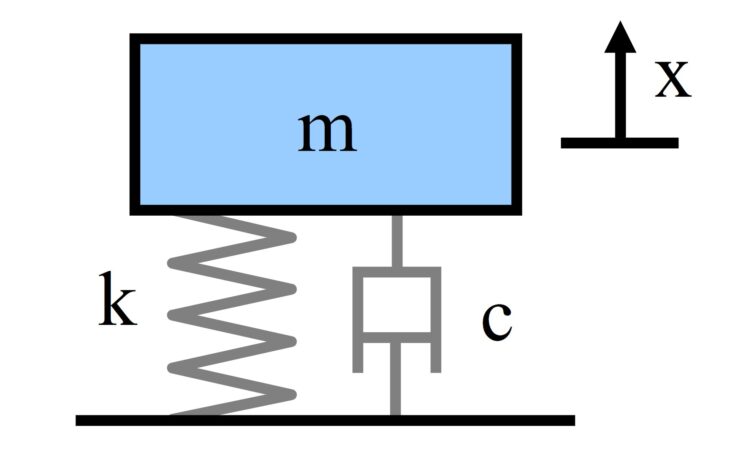
The standard mass-spring-damper model consists of one or more discrete mass node(s) distributed throughout an object and interconnected via a network of one or more springs and dampers (Figure 1). This model is well-suited for modelling repetitively back/forward, right/ left or up/down movements made by objects with complex and nonlinear material properties. Packages such as MATLAB may be used to run vibrational simulations.
Vibration is expressed quantitatively with frequency, displacement, velocity, and acceleration:
- Frequency (F) measures the number of times that vibrating object generates a repetitive motion, usually in one second, quantified in Hz.
- Displacement (D) measures the amplitude (distance) between the peaks of vibration measured in μm, mm, and so on, depending on the circumstances.
- Velocity (V) measures the changing rate of D measured in mm/s, cm/s, and so on.
- Acceleration (A) measures the changing rate of V measured either as m/s2, or the gravitational constant, g.
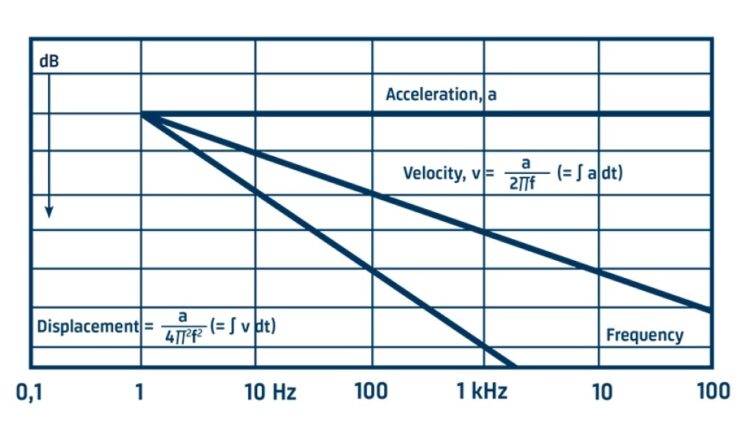
For sinusoidal vibrations, D, V and A have fixed mathematical relationships as functions of frequency and time (Figure 2). When making time-average measurements, ignoring the phase, V can be derived by dividing A by a factor proportional to F, and D can be derived by dividing A by a factor proportional to the square of F.
Objects can be subjected to free or forced vibrations. Free vibration occurs when an object or structure is displaced and then allowed to oscillate naturally. Forced vibration occurs when a structure vibrates as a result of an alternating and/or repetitive force. Free vibration results in the object vibrating at its natural frequency while forced vibration often results in an object vibrating at unnatural frequencies. Forced vibration at or near an object’s natural frequency can cause resonance where the system oscillates with increasing energy which can result in premature failure.
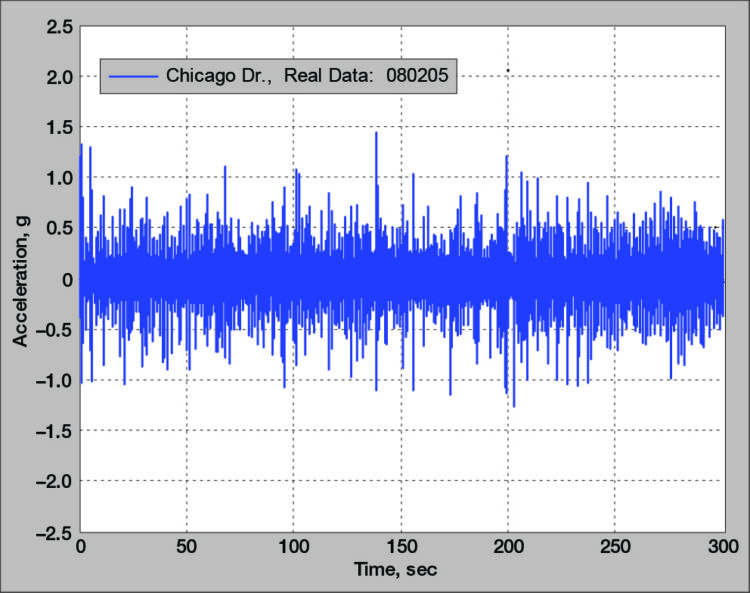
Mechanical systems such as washing machines, compressors, turbines, pumps, and so on, are subjected to random forced vibrations during operation. Even a relatively ‘vibration free’ environment such as the passenger compartment of a car can experience relatively high vibration peaks (Figure 3). Condition monitoring and predicting the need for preventative maintenance is important in many systems. Measurement of acceleration and displacement are important components of conditioning monitoring.
Measuring vibration
The rate of acceleration and magnitude of displacement are the most common metrics for measuring vibration. Accelerometers and noncontact displacement sensors are commonly used to measure vibration.
Accelerometers can produce acceleration information in one of more axes. They are small and are fitted directly on a surface, or within, the object to be monitored. They can be made with discrete mechanical components or fabricated using microelectromechanical systems (MEMS) techniques. Any motion causes the accelerometer to move and the small mass inside it deflects proportionally to the rate of acceleration. The acceleration rate is easily calculated since the mass and spring forces are known quantities.
Inertial vibration sensing using accelerometers is widely used in systems from cell phone handsets to automobiles and spacecraft. In these applications, the vibrations tend to be relatively low frequency, produce low level signals and can have poor signal-to-noise ratios.
An important factor when using accelerometers is the mass of the accelerometer relative to the mass of the object in/on which it’s installed. If the mass differential between the two is not large enough, the system consisting of the object plus the accelerometer will have a different natural resonant frequency compared with the object alone. If present, that factor needs to be accounted for. That is one of the reasons, that MEMS-based accelerometers and noncontact displacement sensors are used.
Noncontact displacement vibration sensors are available using a variety of technologies including capacitive, eddy-current and laser triangulation. These sensors can provide nanometer or sub-micron resolutions and can be used with challenging materials such as silicon, plastics, glass, and miniature electronic and medical components. These small resolutions combined with frequency responses up to 80 kHz enable these sensors to produce precise instantaneous locations even when the target is moving at high speed.
Noncontact sensors have a small gap between the sensor probe and a surface of the target object. Capacitive and eddy-current displacement sensors can provide high-resolution, high-speed measurements. Laser triangulation sensors can also provide high-resolution, high-speed measurements and can operate over longer measuring distances.
Using capacitive technology, the sensor and target form a parallel plate capacitor. When a constant-frequency current flows through the sensor capacitor, the amplitude of the ac voltage on the sensor is proportional to the distance between the electrodes (the target and the sensor). Capacitive sensors can also measure insulators, but are sensitive to changes in the sensor gap dielectric properties and so operate most effectively in clean, dry applications.
Eddy current noncontact displacement sensors operate using an inductive measurement technique. The sensor consists of a coil energized with an alternating current, producing a magnetic field. When an electrically-conducting object is placed in the magnetic field, eddy currents are induced. An integrated MCU uses the change in energy transferred from the sensor coil to the target and calculates the displacement distance. Eddy current sensors are generally small devices and can be used with all electrically conductive materials, both ferromagnetic and non-ferromagnetic. Eddy current technology provides high accuracy which is not susceptible to dust, dirt, oil, humidity, high pressures or dielectric materials in the measuring gap.
Laser triangulation displacement sensors use a laser diode to deliver a point of light onto the surface of the object being tracked. The back-scattered light from that point is captured by a CCD array through a precision optical lens system. These systems have a very small beam width (for highly localized measurements). When the target moves relative to the sensor, the change in the reflected light is measured using the CCD sensor and an integrated MCU can calculate with exact change in position, and thereby the acceleration.
Vibration testing
Two testing regimes are generally used for vibration testing, sinusoidal and random. Sinusoidal vibration tests are relatively simple to administer, but are not nearly as useful as random vibration tests. A sinusoidal test uses one frequency at a time. A random test, can excite any of the frequencies in the defined spectrum at any point in time.
Random testing is important to identify possible weaknesses in a design and to bring the device under test (DUT) to failure. Testing to failure can identify weaknesses in a device and ways to minimize or eliminate those weaknesses. Random testing is more rigorous that sinusoidal testing because random testing “simultaneously” stress all the DUT’s resonances.
Using a sinusoidal test, one resonance frequency may be found to impact the performance of one part of the DUT and another part of the DUT may resonant at a different frequency. Identifying separate resonance frequencies for different parts at different times may not result in failure or even malfunction. But when both of the resonance frequencies are energized at the same time, the DUT could fail. Random testing will energize both resonance frequencies at the same time and identify the potential failure mode.
One of the keys to successful random vibration testing is selecting the correct vibration test spectrum or vibration profile. Industry standards, such as MIL-STD-810, DO-160, MIL-STD-202, SAE J1455, and IEC 60068, offer guidance on choosing vibration profiles, but the profiles need to be optimized for each specific application.
PSD and PDF functions
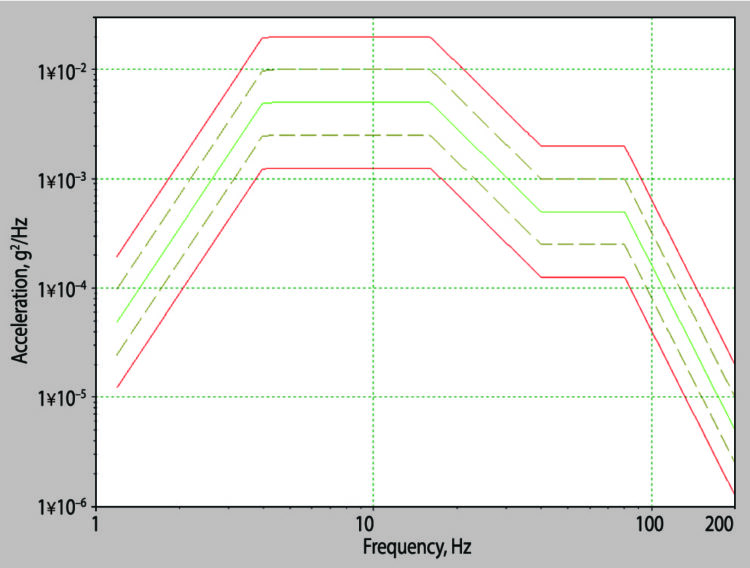
A random test spectrum must be defined before random vibration testing can begin. The random vibration spectrum can be depicted with a power spectral density (PSD) plot (Figure 4). The PSD plots the mean square acceleration per bandwidth (G2/Hz) at each frequency to be used during the test.
Random vibration testing is performed using closed-loop feedback to force the vibrations to exhibit the target PSD. The PSD results from an averaging process and does not correspond to a unique set of time waveforms. A probability density function (PDF) can be used to extract specific information from a PSD test. A PDF is an amplitude histogram. Each point in the histogram is a count of the number of times the measured signal sample was found to be within a corresponding small range (a ‘bin’) of amplitude. Since the PSD implements a random vibration test, the PDF is used to analyze the range of acceleration values produced by the PSD to extract how frequently high rates of acceleration are experienced compared with the overall average value.
Summary
Vibration is an important quantity in physical systems such as electronic devices and in non-physical systems such as gaming and AR/VR applications. It is expressed quantitatively with frequency, displacement, velocity, and acceleration. The fixed mathematical relationship between these quantities means that once the acceleration is known, the other values can be calculated. As a result, accelerometers are the most commonly used vibration measurement sensors. Vibration testing of systems is a complex statistical process based on random variables and relies on the use of power spectral density plots and probability density functions.
References
Comparison of Non-Contact Displacement Sensor Technologies, International Society of Automation
Mass-spring-damper model, Wikipedia
Measuring Vibration: The Complete Guide, Brüel & Kjær
Random Vibration Testing Beyond PSD Limitations, University of Aukland
Vibration Measurement; Vibration Sensors; Measuring Vibration Precisely, Lion Precision
What Is Random Vibration Testing?, Vibration Research