One of the great innovations in modern oscilloscopes is the Math mode. Even in many inexpensive scopes, it generally takes three forms: Dual Waveform Math, FFT, and Advanced Math.
Dual Waveform Math requires two waveforms displayed in separate channels to function, but aside from that, it is quite simple. You just run a couple BNC cables from two arbitrary function generator channels to two oscilloscope channels, and press the Math button on the front panel. Then, in the horizontal menu, press the soft key associated with Dual Waveform Math. With sine waves displayed in both channels of both instruments, in the oscilloscope you see in addition a third sine wave shown in the dedicated Math color code. (In this discussion, we refer to the Tektronix MDO3000 Series Oscilloscope and the AFG31000 Series Arbitrary Function Generator. The steps for other instrument brands may differ, but they are generally analogous to those spelled out here.)
The first vertical Dual Waveform menu lets the user turn Multipurpose Knob a to select the first source and Multipurpose Knob b to select the second. A second menu lets an associated soft key be used to toggle among the four arithmetic operations, add, subtract, multiply and divide.
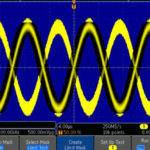
Toggling Add makes the third sine wave equal to the sum of the two sine waves.The subtract operator can be chosen by toggling the soft key. The oscilloscope display at the default 1 MHz frequency may be unstable, but it can be made readable by lowering the frequency in the AFG and pressing Autoset in the oscilloscope. These settings are also suitable for Multiply and Divide.

Top, the integral of a sine wave is another sine wave shifted 90°. In other words, the integral of sin(t) dt = -cos(t), as taught in calculus. Middle and bottom, the square wave and triangle wave and their integrals, respectively.
Suppose you want to take the integral of a sine wave. The integral of a function (which is equivalent to a wave form) is the sum, not instantaneous but accumulated over time. In terms of a waveform, it is the area under the trace.
To take the integral of the displayed waveform on the MDO3000, we turn Multipurpose Knob a to select Intg (. The parenthesis is all important–we are opening a parenthesis along with the operation. Later we will close it. Press Enter Selection. Then turn Multipurpose Knob a to select the channel in which the waveform is displayed. Press Enter Selection. Then turn Multipurpose Knob a to select ), which closes the parenthesis. Press Enter Selection and OK Accept.
Another example is Integrate Square wave. We don’t have to individually edit the Math Expressions. Just scroll through the waveforms in the AFG. The triangle integration resembles a sine wave. When the Triangle wave is at minimum amplitude, Falling Edge, the integral is greatest, and when it is at maximum, Rising Edge, the integral is least in the first cycle. In subsequent cycles, as time elapses, the integral increases, as you can see from the rising integration line.
Scope math functions can come in handy for a variety of everyday tasks. For example, the subtraction function may be helpful for measuring voltage when it’s not possible to ground the probes against one end of the part. In other words, subtraction can give readings that would otherwise require a differential probe. The multiplication function can provide real-time power when the two channels monitor voltage and current (P = V × I). Similarly, applying the integral math function to the power waveform yields energy in Joules. And the log function makes it possible to display waveforms in units of dB.

A sine wave and its log.
Scope power measurements can be helpful for ascertaining whether a transistor or MOSFET stays within safe limits during switching. The V × I trace reveals where and how long the device dissipates peak power. The integral function can also be useful for estimating total battery draw from a device whose current waveform is complex.
The divide function is useful for examining the ratio of an amplified signal. And through use of a fast-rise step (square wave) generator as a driving signal, scope math functions can help instantaneously measure the frequency response of a device under test. The procedure consists of measuring the DUT step response, averaging that to remove noise, taking the derivative of the average, and finally taking the Fast Fourier Transform (FFT) of that derivative.
There are a couple of things to note about the FFT scope function. Even economical scopes often offer different windowing options for the FFT, most often rectangular, Hanning, and flattop. Particularly on less expensive instruments, these modes are left unexplained. Here are a few basics.
The idea of a windowing function is to multiply the signal by the selected window function and display the result. Windowing functions are designed to help the FFT extract spectral data from signals that are non-periodic. These selectable functions reduce the effects of the leakage that happens during the calculation of the FFT. Here leakage refers to spectral information from an FFT showing up at the wrong frequencies.
The simplest type of window is the rectangular or boxcar window. It is characterized as having a high resolution but low dynamic range, meaning it is good for distinguishing frequency components of similar amplitude even when the frequencies are also close together, but poor at distinguishing components of different amplitude even when the frequencies are far away. Rectangular windows are good for revealing relatively weak sinusoids in the presence of additive random noise because the noise produces a stronger response with high-dynamic-range windows than with high-resolution windows.
Rectangular windows work well with periodic signals–there’s no distortion because of the windowing function. And periodic signals don’t necessarily have to be sine waves. They can include “burst random” signals that start and end at zero during the measurement time, sinusoids that have an integer relationship to the measurement time, and impact measurements that fully decay within the measurement time.
But with non-sinusoids, rectangular windowing can reduce the signal amplitude by up to 36% and can spread the frequency content over the entire bandwidth of the measurement. The non-periodic case calls for a different windowing function.
One candidate is the Hanning window, named after its inventor Von Hann. It has the shape of one cycle of a cosine wave with one added to it so it is always positive. Thus the Hanning window starts and ends at a value of zero. In the center of the window, it has a value of one. This gradual transition between zero and one ensures a smooth change in amplitudes when multiplying the measured signal by the window, which helps reduce the spectral leakage.
Hanning windows are often used with random data because they don’t much degrade the frequency resolution and amplitude accuracy of the resulting frequency spectrum. The maximum amplitude error of a Hanning window is 15%, while the frequency leakage is typically confined to 1.5 spectral lines to each side of the original sine wave signal.
If the Hanning window is used on sine wave that is captured periodically, the error would be 0%. The maximum error of 15% occurs when the sine wave is half way between two spectral lines. If the sine wave frequency was one fourth of the distance between two spectral lines, the amplitude error would be 7.5%.
Like a Hanning window, the Flattop window begins and ends with a value of zero. The center of the window has a value of one. But the Flattop window has a less amplitude error in the frequency domain–less than 0.01%–compared to the Hanning window. A Flattop window confines leakage to 3.43 spectral lines to each side of the original signal. This is a wider frequency range than the 1.5 spectral line width of the Hanning window.
The Flattop window doesn’t distinguish different frequencies as well as a Hanning window. So the Flattop window is typically employed on data where frequency peaks are distinct and well separated from each other.