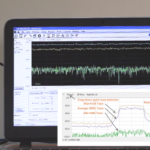
A Tektronix RSA306B PC-based spectrum analyzer demonstrates save and recall functions, using a PC’s interactive on-screen controls.
Greetings once more and welcome to our 73rd Test and Measurement video. Today we are looking at the Save and Recall capabilities in the Tektronix RSA306B PC-based spectrum analyzer.
By way of background, a brief discussion of spectrum analyzers is in order. The major oscilloscope manufacturers also offer spectrum analyzers, which are similar in that both instruments have screens that display electrical waves in graphical form. Oscilloscopes are used to display these signals primarily in the time domain with a Fast Fourier Transform mode that may be used to access the frequency domain. Spectrum analyzers, in contrast, are exclusively frequency domain machines. While they are limited that way, within the frequency domain they have specifications and features that go beyond oscilloscopes. But spectrum analyzers definitely have a steeper learning curve. Typically, for comparable bench-top instruments, a spectrum analyzer is a lot more expensive and outside of electronics labs and more advanced repair shops, the oscilloscope with FFT has had to suffice.
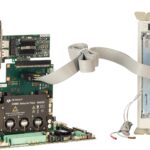
With the introduction by Tektronix of its RSA306 PC-based spectrum analyzer, that has changed. Assuming that the user already owns or has access to a PC, this is a far less expensive alternative to the bench-type spectrum analyzer. The PC-based spectrum analyzer is a simple module without external controls or moving parts. Its purpose is to acquire an electrical signal, through an antenna or BNC cable that is attached to an RF adapter. This signal can come from a demo board, exterior arbitrary function generator or other source.
Using SignalVu-PC software in conjunction with the PC, we can save spectrum analyzer displays and setups in several formats, and we can recall this data for subsequent analysis or storage.
In the demo board, keep the same settings as in Video 72. If they need to be restored, follow this procedure:
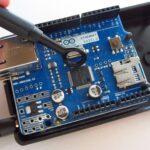
1. Press the On button in the Demo Board. LED’s throughout light up indicating that the Demo Board is prepared to output signals to the connected RSA306B spectrum analyzer
and through it to the PC.
2. Set Reference to Internal.
3. Set the Run Mode to Free Run.
4. Click the Row and Column buttons to select OFDM to determine the Demo Board output. This completes the procedure for configuring the Demo Board.
In the Tektronix RSA 306B, keep the same settings or follow this procedure:
1. Recall the setting Demo2_OFDM_marker.tiq. Click Run.
2. Right click the screen, and select All Markers Off.
3. Click the Settings button to display the Settings Control Panel.
4. In the Traces tab, select Trace 1 and then set Detection to AVG (VRMS) and set Function to Avg (VRMS).
5. Select Trace 2 and then set Detection to +Peak, Function to Max Hold, and enable Show.
6. Select Trace 3, select Detection to –Peak, Function to Min Hold, and enable Show.
7. Select Save As from the file menu to open the Save As dialog box.
• The trace and numeric data are saved as CSV files.
• Measurement Settings (TXT) – Saves a list of settings relevant to the selected measurement to a text file. This option is useful for including the measurement settings in
reports.
• Various traces – Saves a trace for later recall into the display from which it was saved.
• Data (.tiq/CSV/MAT) – Saves data and measurement setups for analysis later (.tiq format) or as data to use with external software in either CSV or MATLAB formats.
Thanks for watching. New videos are added periodically, so check back frequently.

Leave a Reply
You must be logged in to post a comment.