The phrase and concept “orthogonal” is widely used in engineering, but it is also often misunderstood.
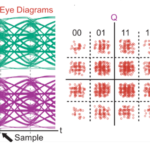
We can look at orthogonal signals in multiple ways: in the time domain, the frequency domain, as a constellation – a presentation which is widely used in the broad discipline referred to as signal processing, and as an eye diagram. Designers need to look at the relationship among the various signals in the signal space to see where the thresholds should be for decoding (deciding) which symbol was received, what is the distance between symbol representations to assess the impact of noise, to see any distortion in the channel, and more.
There are two useful tools for this: the constellation diagram and the eye pattern. Both allow the designer to easily and qualitatively observe, in real time, the dynamic effects of noise, changes, tuning, filters (adaptive and other), and other intentional or unintentional changes to a channel, circuit, hardware, or algorithm. This makes both very powerful and dramatic tools.
The constellation diagram
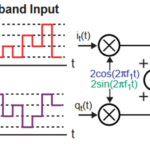
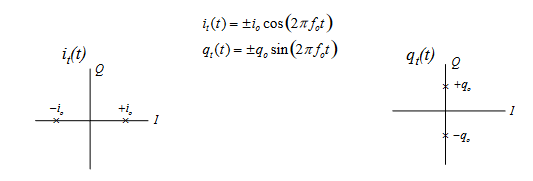
The constellation diagram is a two-dimensional plot with the x-axis representing the magnitude of the I signal and the y-axis representing the Q signal. It can be set up on a standard oscilloscope, which adds to its convenience.
For a simple binary case, the respective signals fall on either side of the 0 point of the x-y graph (Figure 1).
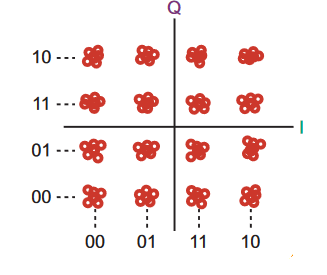
For a perfect 16-QAM system, the constellation pattern looks a little more complicated, of course (Figure 2):

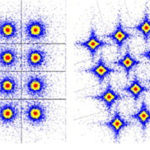
What happens to the constellation diagram as the real-world imperfections affect the signals, or there are timing errors (jitter and skew) in the transmit or receive clocks? The perfectly placed and spaced dots on the diagram start to get “fuzzy” around their center point and the constellation points no longer consist of single points for each symbol (Figure 3).
As noise, distortion, phase shift, and timing errors increase, the points representing the symbols get closer and closer to each other, showing how the noise margin between them is shrinking (Figure 4).
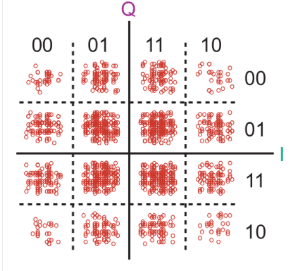
In fact, in extreme cases, the point “cloud” of a symbol overlaps with its neighbors, showing that it is no longer possible to determine the correct value without error. The fuzziness does not have to be symmetrical around the original point, and often is not. Changes in signal relative spacing of magnitude cause the points to move closer or further away along their I or Q axes, respectively. Shifts in phase cause the point to move (rotate) towards the other axis and the ideal 90⁰ quadrature difference.
Although the constellation is a convenient qualitative tool, it is also quantitative. By measuring the amount of left/right, up/down, and rotational shifting, a great deal can be determined about the channel and system performance and impairments. As the constellation diagram has a 0,0 center origin with information in both its x and y axes as well as its rotational angle, it provides a “polar” perspective on the signal situation – hence the name by which it is sometimes referred, rather than constellation.
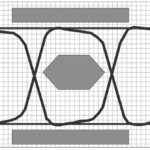
The next part will look at the eye diagram, which is often used in conjunction with the constellation.
EE World Related Content
The basics of 5G’s modulation, OFDM
Is Li-Fi “To Be” or “Not To Be”? Part 2 – Attributes
Reaction wheels ensure satellites maintain the right attitude: Part 1
What does an eye diagram or eye pattern on an oscilloscope mean?
Basics of eye diagrams
Eye and Constellation Diagrams, Pt 2
Eye and Constellation Diagrams, Pt 1
Electric locomotives and catenary power systems – Part 3: power delivery
Generating sine waves from triangle waves
Additional References
Orthogonality
- Physics Classroom, “Forces in Two Dimensions”
- Stack Exchange, “When are two signals orthogonal?”
- Wikipedia, “Orthogonality”
- All About Circuits, “Orthogonal signals”
- Math Reference, “Fourier Transforms, Sines and Cosines are Orthogonal”
- Math Stack Exchange, “What does it mean when two functions are “orthogonal”, why is it important?”
- MIT, “Orthogonal Functions and Fourier Series”
- University of California/Berkeley, “Orthogonal Signaling”
- MIT, “Analog and Digital I/Q Modulation”
- Princeton University, “From AM Radio to Digital I/Q Modulation”
- Tektronix, “What’s Your IQ – About Quadrature Signals”
- NuWaves Engineering, “Application Note AN-005: Understanding Constellation Diagrams and How
They Are Used” - com, “What is a Constellation Diagram?”
- Keysight Technologies, “Concepts of Orthogonal Frequency Division Multiplexing (OFDM) and 802.11 WLAN”
Orthogonal versus uncorrelated: issues
- Stack Exchange, “What is the relationship between orthogonal, correlation and independence?”
- Statistics How To, “What is Orthogonality in Statistics?”
- GitHub, “Orthogonality Does Not Imply Uncorrelated-Ness or Independence”
- Brereton, R. G., Journal of Chemometrics, “Orthogonality, uncorrelatedness, and linear independence of vectors”