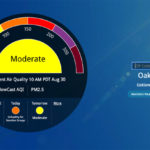
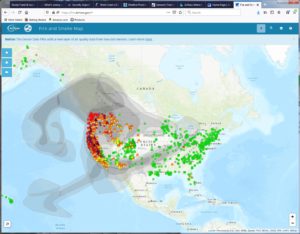
With over 90 forest fires raging along the West Coast, you may feel safe and think you do not need to check the air quality index (AQI) if you don’t live in that region. Think again! A recent satellite image shows that the smoke already extends all the way to Michigan. Don’t smell any smoke? Still not safe. Recent AQI readings in the region near the fires were in the 200s (very unhealthy, see What is the Air Quality Index? Pt 1) but you couldn’t smell any smoke.

The reported AQI is a time-averaged statistic, measured using a 24-hr increment. Measurements within a 24-hour period require additional calculations. AirNow and PurpleAir, the two common reporting systems, provide interesting examples of different reporting techniques.
AirNow, a partnership of several U.S. as well as tribal, state and local agencies) uses permanent and temporary professional grade sensors for AQI ozone and particle pollution (PM10 and PM2.5) measurements. In addition, the Sensor Data Pilot from the Environmental Protection Agency (EPA) and the United States Forest Service (USFS) adds data from low-cost sensors to the Fire and Smoke map. Maps showing AQI colors from permanent monitors use colored circles and the temporary monitors use triangles to identify the most recent readings. Square colored indicators show the locations of the low-cost sensors. AirNow infers regional air quality values in -hour increments. For a specific area, such as Oakland, a single professional grader sensor could provide the reading.
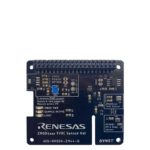
In contrast, PurpleAir, a private company, provides real-time AQI readings through an Internet of Things (IoT) network of sensors. Using PMS5003 and PMS1003 laser particle counters, PurpleAir PA-II and PA-II-SD sensors count suspended particles in 0.3, 0.5, 1.0, 2.5, 5.0 and 10 µm sizes. With numerous lower-cost sensors installed in a variety of locations, the coverage is much more granular, and the data is viewable in real time.
How does the data from the two approaches correlate? Next time in Part 3.

