
EV powertrain sizing requires engineers to satisfy two conflicting demands at once. A motor must deliver brief, high-torque bursts for acceleration. It must also sustain continuous output across hours of highway driving or repeated hill climbs. These demands impose different constraints on every component in the drivetrain.
This technical FAQ examines how engineers quantify worst-case peak demands, how thermal simulation sets the continuous power ceiling, and how optimization resolves the resulting trade-off.
Calculating the worst-case power and torque demand on an EV drivetrain
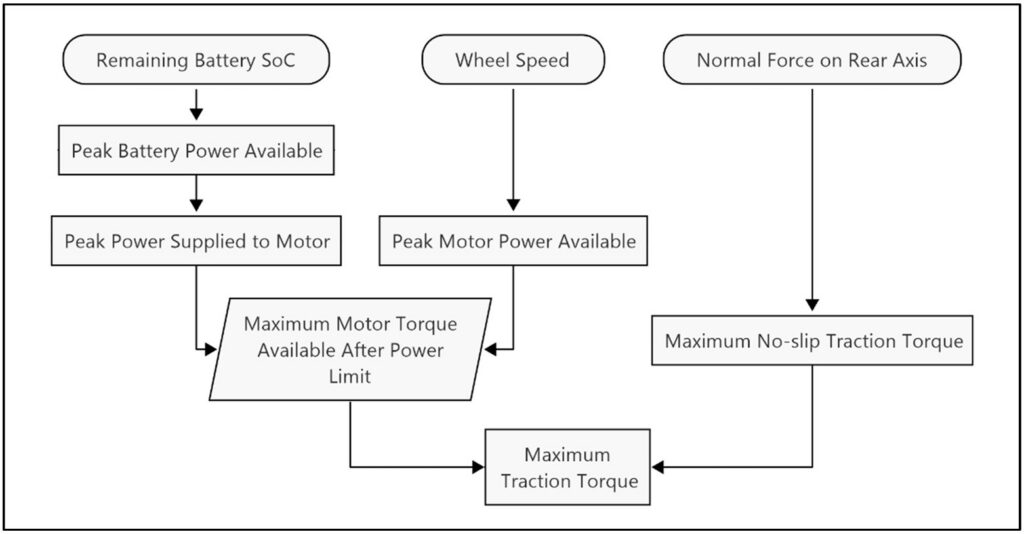
Before evaluating any thermal constraint, engineers must know the maximum power the drivetrain must handle. The standard tool is the wide-open throttle (WOT) forwards-facing model. It traces peak battery discharge through the motor and drivetrain to the maximum traction torque the wheels can accept.
The model works from the power source outward. Peak battery power available and peak motor power available feed into the calculation. Maximum traction torque is the output. A tyre-road friction coefficient of 0.95 caps the traction ceiling.
Beyond this point, the wheels cannot transfer additional torque to the road surface regardless of what the motor generates. Any motor torque above that limit goes unused. Figure 1 shows how the model traces this chain from battery to wheel.
The forwards-facing model (FFM) uses real battery discharge curves, motor efficiency maps, and drivetrain losses to evaluate performance from the power source outward. It does not rely on idealized assumptions. To actually size the components, however, engineers use a backward-facing model (BFM), which applies a requirement-based design (RBD) methodology.
Using the BFM, engineers start from vehicle-level targets such as range and acceleration time. Then work backward to derive the minimum component specifications that satisfy them. This process ensures peak sizing becomes demand-driven rather than overspecified.
What determines how much power an EV motor can sustain without overheating?
Once the peak demand is established, the question becomes how much of it the motor can actually sustain. The answer does not come from electromagnetic analysis. It comes from thermal simulation.
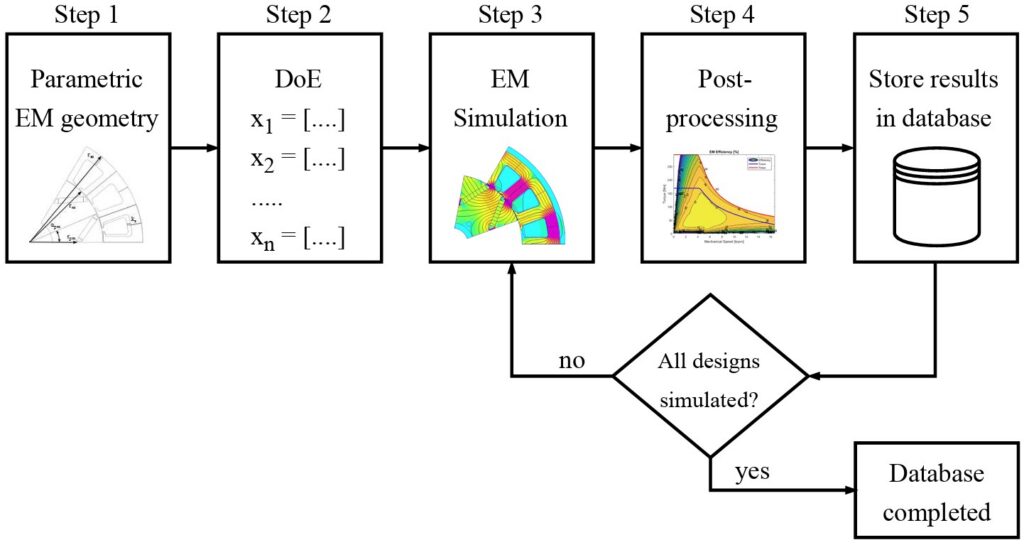
The first step is calculating the nominal current loading. This is the current motor’s capacity that it can carry indefinitely under its specified cooling conditions. Every subsequent electromagnetic property and performance map follows from this thermally-constrained baseline. A motor running above the nominal loading accumulates heat faster than the cooling system can remove it. Figure 2 shows the generation process for an electric machine database, with thermal simulation as the mandatory first step.
The thermal model uses eight lumped-parameter nodes. These track the temperature at the stator iron yoke, stator teeth, end windings, slot windings, rotor magnets, rotor shaft, bearings, and outer case. Each node connects to the coolant through a defined thermal resistance path.
The cooling boundary condition is forced convection at 600 W/(m²·K) into 80°C coolant. Engineers can adjust these values to model different architectures, including water jackets, oil spray, or air cooling.
Two hard thermal ceilings govern the continuous power rating. Windings are limited to 150°C, the threshold for Class F insulation before degradation begins. Rotor magnets are limited to 120°C, above which permanent magnets risk irreversible demagnetization.
The overloading factor (kov) is the ratio of peak to nominal current. It quantifies the headroom between the continuous rating and the thermal ceiling. Inverter sizing must accommodate this kov multiplier for peak torque events. The kov value directly sets the boundary between continuous operation and transient thermal overshoot.
Balancing rated power and peak torque when finalizing an EV powertrain design
Sections one and two define the two boundaries that govern motor sizing. The WOT model sets the peak torque floor. Thermal modeling sets the continuous current ceiling. The engineering challenge is satisfying both simultaneously at an acceptable cost and energy consumption level.
Multi-objective optimization maps this trade-off explicitly. The optimization explores rated motor power from 70 to 120 kW and rated motor speed from 4,000 to 6,000 rpm.
Every candidate design must meet three simultaneous performance constraints, including a gradient climb above 20%, a top speed above 150 km/h, and a 0 to 100 km/h time under 12 s. A wheel slip constraint also applies. The wheel slip coefficient is capped at 1.02, linking peak motor torque directly to road surface physics.
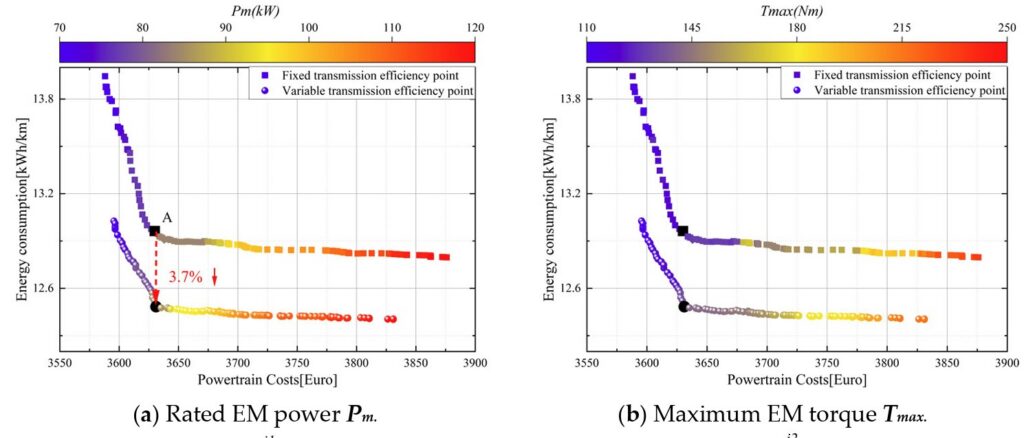
The Pareto frontier in Figure 3 maps powertrain cost against energy consumption per 100 km. Rated continuous power (Pm) and maximum torque (Tmax) are color-coded across the candidate population. Designs on the frontier are not better or worse than each other. They represent different choices about where to accept cost or efficiency trade-offs. The optimization confirms that pairing a higher-power motor with a smaller transmission ratio achieves better energy efficiency. The variable speed efficiency model (VSEM) reduces energy consumption by 3.3 to 3.7% compared to a constant speed efficiency model (CSEM). The gain comes from keeping the motor within its high-efficiency zone across a wider range of conditions.
Motor cost enters the trade-off directly. At 8 EUR per kW of rated power, a 10 kW increase in Pm adds 80 EUR to the powertrain cost. That cost difference discourages oversizing the continuous rating beyond what the duty cycle demands.
Summary
EV powertrain sizing is a three-stage process. Engineers first calculate the worst-case peak demand using a WOT model. Thermal simulation then sets the continuous power ceiling, where nominal current loading and temperature limits on windings and magnets define what the motor can sustain. Multi-objective optimization resolves the trade-off between these two boundaries, identifying which rated power and peak torque combinations meet all constraints at minimum cost.
References
BEV Powertrain Component Sizing With Respect to Performance, Energy Consumption and Driving Patterns, Chalmers University of Technology
Design and Optimization of an Electric Vehicle Powertrain Based on an Electromechanical Efficiency Analysis, Processes, MDPI
Rapid Decision-Making Tool for Electric Powertrain Sizing for Motorcycles during New Product Development, Energies, MDPI
Optimization of Electric Powertrains Based on Scalable Cost and Performance Models, Academia
EEWorld Online related content
Hot topic: Electric vehicle components get more sophisticated thermal models
Q&A: How engineers are rethinking thermal management for EVs
What is the difference between an EV powertrain and drivetrain?
What comprises an EV powertrain?
FAQ on traction motors: part 1
Optimizing EV motor design