
Raman spectroscopy is a powerful investigative measurement technique based on optical and quantum-physics principles of Raman scattering. It involves illuminating a substance with a laser and analyzing the light that is scattered off the surface of the substance.
It is widely used for non-invasive, non-destructive assessment of the molecular composition of materials. One of its interesting attributes is that it can do so even if the material of interest is not directly accessible but is in a clear or translucent container, yet it can yield detailed information about chemical structure.
This FAQ will look at Raman scattering and spectroscopy from various perspectives, including its optical physics, history, implementation, applications, instrumentation, and even limitations.
Q: Why should electronic/electrical engineers even be interested in this “optical” topic?
A: There are several reasons:
- First, although it is an optical technique, it uses many electronic and electro-optical components such as LEDs and their drivers, photodetectors of various types, power supplies, analog-based signal processing chains, and data analysis.
- Second, electronics and optics are increasingly intertwined disciplines with electro-optical components, devices, and systems becoming more widely available and used.
- Third, there’s been increasing research, development, and even commercialization of electro-optic systems-on-chip, which integrate advanced optical functions such as interferometers on chip along with electronic functions.
Q: What is the basic principle of Raman scattering?
A: As with almost anything related to advanced optics and physics, it is not at all obvious or intuitive, nor is it “tangible.’ Nonetheless, it is based on solid theory, demonstrable experiments, and real-world applications.
When light impinges on and then is scattered off a material, there are two possible outcomes called elastic and inelastic scattering, as seen in Figure 1. Note that in ordinary conversation, people often use the term “reflection” for what optical scientists call scattering; scattering is a broader, more encompassing term.
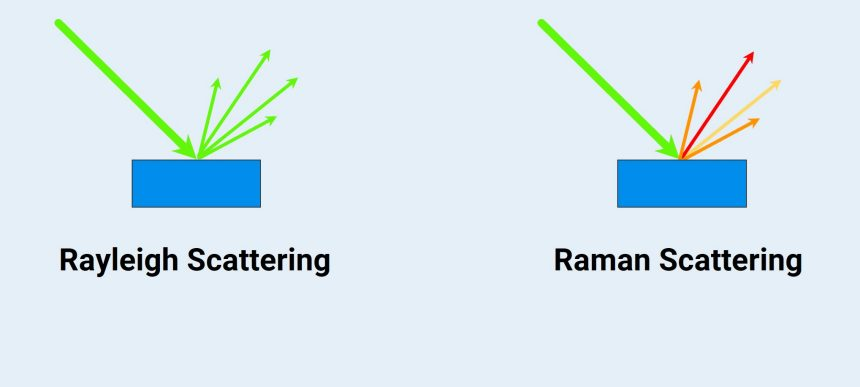
In elastic scattering, also known as Rayleigh scattering, the scattered light has the same energy as the light that initially struck the sample. This means that the elastically scattered light will be the same frequency, wavelength, and color as the original beam of light. This is what we are familiar with in daily life
In inelastic scattering, also called Raman scattering, the scattered light has a different energy than the light that initially struck the sample. This means the inelastically scattered light will have a different frequency, wavelength, and color compared to the original beam of light.
The second outcome is not intuitive or apparent in “normal” life. Note that only a small proportion of photons are scattered this way, with a loss or gain of energy to molecular vibrations. When a Raman event is observed, energy from incident laser photons is transferred to the target, resulting in emitted photons that are shifted to different frequencies. This inelastic form of scattering only affects approximately 1 in 10 million impinging photons.
Start with deep-optic and quantum physics
Q: Is that all there is to the physics of Raman scattering?
A: No, things are rarely this “clean” in the world of quantum effects and optical physics.
Q: How so in the Raman scenario?
A: When emitted photons are shifted to a lower energy, as seen in Figure 2, it is called a “Stokes shift”; when the resulting photons are emitted at a higher energy, it is called an “anti-Stokes shift.” Stokes lines are the most commonly used in Raman applications.
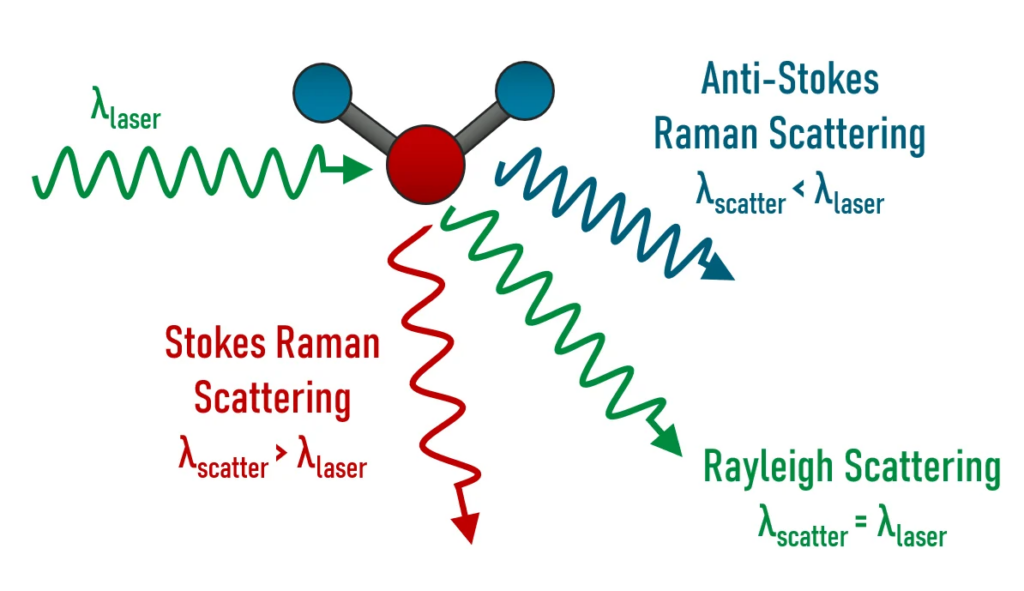
Anti-Stokes lines are typically weaker, especially at greater shifts, as these depend on a population of the molecules being in a higher vibrational energy state (materials that are often simply hotter). Raman spectroscopy probes the different and unique vibrational modes of the covalent bonds present in the analyte to yield information about its chemical structure.
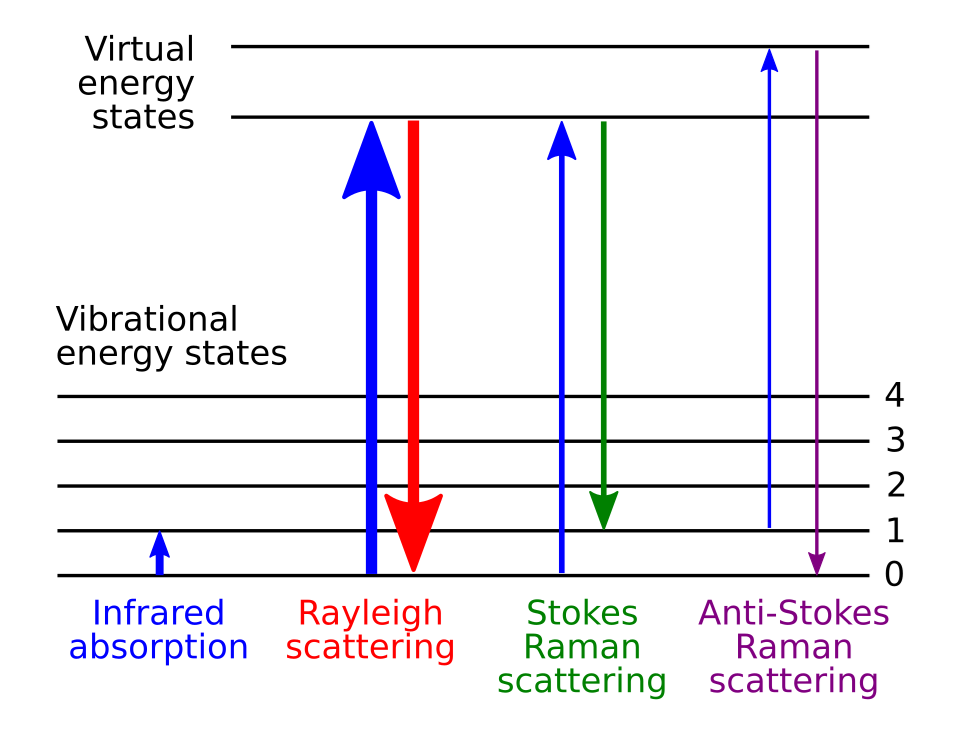
Q: That’s a nice figure, but it doesn’t clarify the energy-level and energy-shift situation; can you expand on that?
A: The energy level diagram of Figure 3 clarifies the situation.
Some brief historical background
Q: Is recognition of the principle of Raman scattering a relatively recent development?
A: Not at all! The story of Raman spectroscopy begins in 1923, when Adolf Smekal theorized that light could be inelastically scattered. Five years later, Indian scientist Chandrasekhara Venkata Raman (C.V.) Raman studied how light travelled through different liquids and was able to observe the inelastic scattering Smekal predicted. This discovery earned Raman the Nobel Prize in Physics in 1930.
Q: I don’t recall seeing much about Raman scattering or any Raman spectrometers in instrumentation stories of most of the 20th century – why not?
A: The first Raman spectrometers were created soon after, in the early 1930s, by the physicist George Placzek, which allowed scientists to investigate and document molecular vibrations in a wide array of molecules. However, the effect wasn’t practical for many decades, largely due to limitations n the light sources used at the time, usually a mercury-vapor lamp that was filtered to create a monochromatic beam. The beam resulting from this was very weak, which meant experiments took hours, sometimes days, to conduct.
Q: What changed this?
A: In a word, and no surprise here at all: the laser. Lasers provide a strong monochromatic light source, of course. Further, lasers are now available for different wavelengths so the Raman light source can be optimized to match the measurement challenge of materials and sensitivity issues.
Raman spectrum examples
Q: How is a Raman spectrum created?
A: To detect the Raman effect, it is necessary to determine the frequency shift (the Raman shift) between the original beam of light and the Raman-scattered light. With a laser and its monochromatic output, the frequency of the original light beam is known.
When the sample is illuminated with the laser, some of the laser light will be absorbed by the sample to excite molecular vibrations, causing Raman scattering. The Raman scattered light is then collected at a detector to determine its wavelength/frequency, thus providing the information needed to determine the Raman shift. Note that a narrow-bandpass, frequency-selective optical filter is used to filter out Rayleigh scattering at the original laser wavelength.
Q: What does an actual Raman-spectrum plot look like?
A: Obviously, it depends on the target material under investigation (called the “analyte” in this discipline), and so there is no single example. Figure 4 shows an example comparing aspirin and acetaminophen.
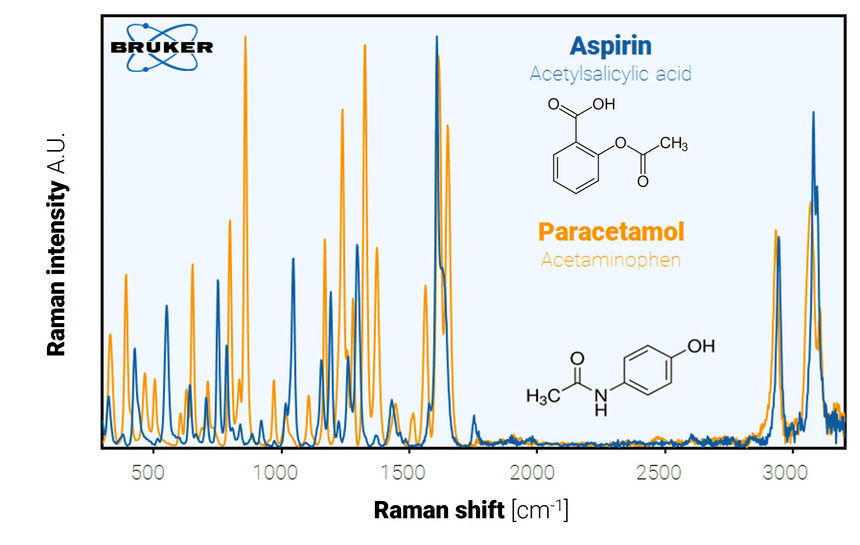
Note: the units designation of cm⁻¹ (“per centimeter”) is the reciprocal centimeter or wavenumber in optics and indicates how many waves fit into one centimeter. It is a widely used unit in spectroscopy to describe the frequency and energy of light, especially in infrared and optical systems.
Q: How are these Raman shift spectra used in practice?
A: There are libraries available with thousands of Raman-scattering spectrum images. These can be compared to the unknown images of interest.
The next part of this article looks at practical issues and implementation of Raman spectroscopy.
References
Raman Spectroscopy Overview, Agilent Technologies
Raman spectroscopy – Basic principle, instrumentation and selected applications for the characterization of drugs of abuse, Science Direct
Guide to Raman Spectroscopy, Bruker Corporation
Raman Spectroscopy, Wikipedia
Basic Principles of Raman Scattering and Spectroscopy, Edmund Optics Inc.
AI Opens Opportunities to Deploy Raman Spectroscopy, Photonics July 2026
Related EEWorld Online content
An Inexpensive and Flexible Micro-Raman System
What are next-generation bio sensing techniques? Part 1
What are next generation bio sensing techniques? Pt 2
What’s new in glucose sensing?
Smart Device Detects Food Contaminants in Real Time
Basics of spectrometers and spectroscopy