
The first part of this article looked at the principles of Raman scattering and spectroscopy. This second and final part looks at implementation issues and instrumentation based on the principle.
Q: What are some of the attractive attributes of Raman scattering and spectroscopy?
A: There are many. Among them is that Raman spectroscopy is non-invasive and non-contact, nor does it require any special sample preparation before analysis. Analysis can be performed on “raw” samples or through transparent or opaque containers (called SORS; more on this later). Further, Raman spectroscopy can be used for quantitative and qualitative analysis
Q: How does Raman scattering develop a chemical fingerprint?
A: Each peak on the Raman spectrum corresponds with a different frequency of light absorbed by the sample which excites a vibration. Since these frequencies are unique to the molecule and the types of bonds it contains, the Raman spectrum creates a unique fingerprint that allows identification of a large variety of substances.
Q: What are some of the challenges in doing so?
A: Consider oxygen and nitrogen, two fundamental gaseous elements. When illuminated by a suitable laser wavelength, there will be a peak Raman shift for oxygen around 1550 cm-1 and one for nitrogen around 2330 cm-1, as seen in Figure 1, making them easy to tell apart.
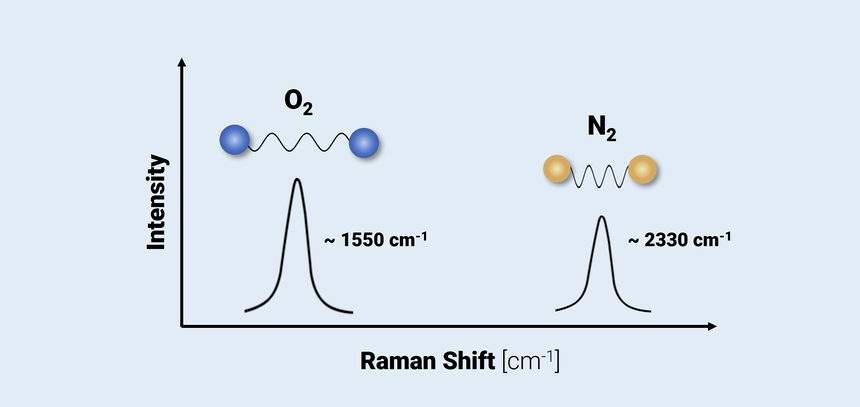
Raman scattering and spectroscopy challenges
Q: Sounds easy enough, so what’s the problem?
A: Most molecules of interest are complicated, with many chemical bonds and thus many different molecular vibrations. As a result, the Raman spectra for most molecules will contain many peaks. That’s where the libraries address the matching needs.
Q: What about optical “access”?
A: Conventional Raman spectroscopy instruments illuminate a sample with a laser, and the sensor for the return scatter is co-located with the laser source (called co-axial illumination). To improve optical “reception,” an arrangement called spatially offset Raman spectroscopy (SORS) is used; it is analogous to using multiple antennas at the RF receiver.
SORS uses multiple measurements to probe the subsurface of a sample—and often allows materials to be identified inside sealed, thick, colored, and even apparently opaque containers that actually have optical “windows” at some wavelengths that allow light to pass. It is especially useful in improving the speed, efficiency, and safety of hazardous material identification, airport security liquids screening, and pharmaceutical raw material verification.
Q: What is another impediment to successful Raman spectroscopy?
A: Sample fluorescence is a problem. Fluorescence occurs when a substance absorbs light, then emits light that is lower in energy. This is different from the Raman effect, where light that matches the frequency of molecular vibrations is absorbed, and the rest of the light is scattered.
Light absorbed and emitted due to fluorescence does not correspond to vibrations, so it isn’t useful in Raman spectroscopy. However, the detector inside a Raman spectrometer can’t distinguish between the light emitted due to fluorescence and the light from Raman scattering. This means that if the sample in a Raman experiment fluoresces, the emitted light will show up on the Raman spectrum. Fluorescence interferes with the Raman spectrum, since fluorescence peaks are larger and broader than Raman peaks, making the Raman peaks difficult to distinguish.
Q: What can be done about fluorescence?
A: Sometimes using a visible light laser with a different color (wavelength) is enough to avoid fluorescence. However, the best solution to avoid fluorescence in Raman experiments is to use a laser in the near-infrared (NIR) region, such as at 830 nanometers (nm) and 1,064 nm, as these usually produce less fluorescence in the sample. To do this, a special type of Raman spectrometer with infrared light is used for analysis, called a Fourier transform (FT) Raman spectrometer.
Physical implementation
Q: What does a typical Raman spectrometer look like?
A: Raman spectrometers are either dispersive or use a Fourier-transform technique (FT-Raman) that is similar to Fourier-transform infrared (FTIR). For the dispersive Raman spectrometer, the main components, as seen in Figure 2, are:
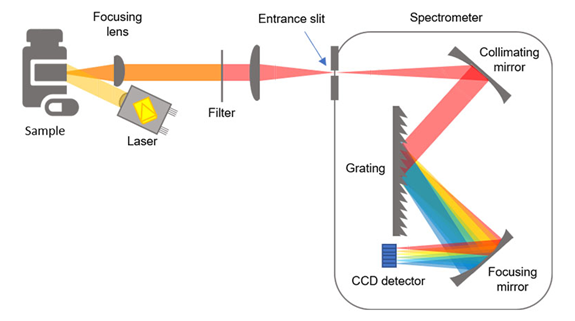
The spectrometer consists of these elements:
- The excitation source: A single-wavelength line source (a laser) is used to excite or trigger the analyte to a virtually excited state. The choice of laser wavelength is critical as the intensity of the Raman signal is inversely proportional to the fourth power of the laser wavelength (∝ λ4); also, the wavelength should not induce interfering fluorescence.
- Detector: The photodetector is used to record the intensity of the signal at each scattered wavelength.
- Narrow-bandpass optical filter: This eliminates Rayleigh scattering and anti-Stokes scattering in most conventional Raman spectrometers.
- Diffraction grating: This disperses and separates Raman bands according to wavelength.
- Entrance slit where the sample light is focused: Typically, the narrower the slit, the better the spectral resolution.
- A combination of notch filter and grating filters: These further isolate the single-wavelength laser beam to ensure narrow bands.
A benchtop version is shown in Figure 3:
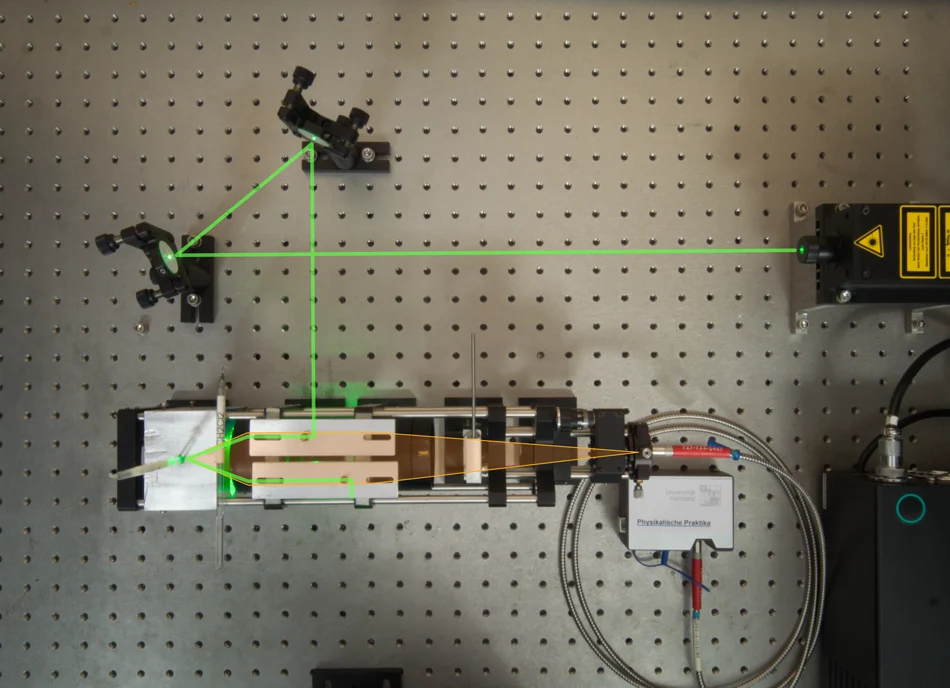
Raman spectroscopy units you can buy
Q: Is Raman spectroscopy only possible in a benchtop, lab-based, non-portable arrangement?
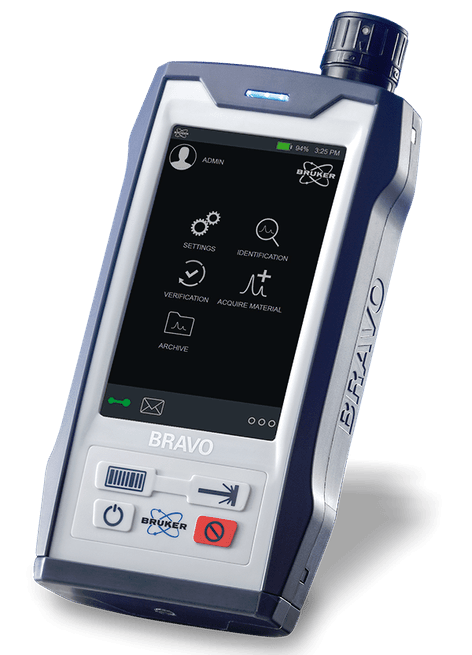
A: Absolutely not. Using modern optical and electronic components and technologies, there are spectrographs available as convenient, portable, handheld units such as the BRAVO unit of Figure 4.
This Raman spectrometer is classified as a Laser Class 1 device in all operating modes, thus offering user safety with no need for laser-safety training, a laser-safety program, or special precautions such as personal protective equipment. It incorporates many advanced performance features such as fluorescence mitigation SSETM (Sequentially Shifted Excitation), a patented fluorescence-mitigation method based on controlled temperature variations of the laser.
Q: Is there a relationship between optical microscopy and Raman spectroscopy?
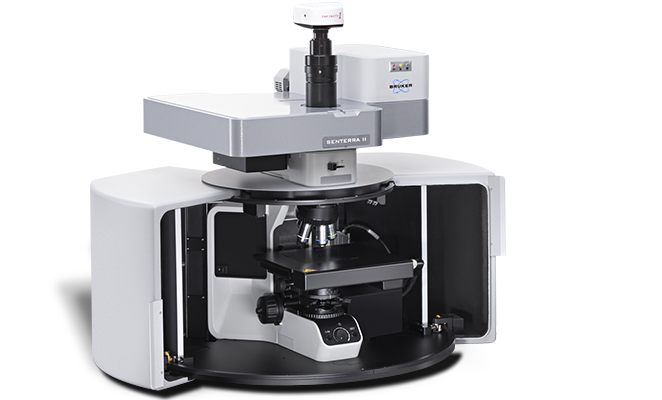
A: Yes, there is. Raman spectroscopy usually uses a laser in the visible range, which can easily pass through any transparent material. This makes it easy to use it with a traditional light microscope since the laser light can pass through the sampling slides and microscope lenses. Combining these two technologies results in a Raman microscope, as seen in Figure 5.
It has a simple “point and shoot” design that requires little or no sample preparation. The optical microscopy allows samples to be examined visually with the microscope, and then analyzed with Raman spectroscopy with a built-in laser, allowing detailed chemical images to be created.
Raman limitations
Q: What are some limitations on Raman spectroscopy?
A: The main limitations of Raman spectroscopy involve signal detectability. Low detection can be because a material is 1) not Raman “active”; 2) emits a weak Raman signal (a Raman “event” is observed on average just once for every 106 to 108 excitation photons), or 3) is swamped by fluorescence. While the first of these is insurmountable without changing the nature of the sample, there are various advanced techniques available to overcome or mitigate the other two.
Q: What is an “active” Raman material?
A: Materials with no covalent bonds and intensely colored materials cannot be characterized with Raman spectrometers. However, most samples in key Raman application areas, such as those related to pharmaceuticals, their quality control, and hazardous material identification) are Raman active (HCl and NaCl are notable exceptions).
Q: Can you say more about active Raman materials? What works well?
A: These include:
- Organic materials such as active pharmaceutical ingredients, organic solvents, polymers, harmful narcotics, and explosives.
- Polyatomic inorganics such as magnesium sulfate, sodium bicarbonate, titanium dioxide, and calcium phosphate.
- Molecules containing only single bonds: C-C, C-H, or C-O (such as aliphatic, sugar, starch, cellulose).
- Highly polar small molecules such as ethanol.
Q: What does not work well?
A: The list includes:
- Materials with no covalent bonds: purely ionic species (such as NaCl and KCl).
- Highly fluorescent samples including plant-based materials.
- Black or dark-colored samples as the material may completely absorb the laser light.
- Any substance with a weak Raman signal within the region being examined (such as water in the region of 200 to 2,000 cm-1).
- Most metals and elemental substances.
Q: What is the impact of artificial intelligence on Raman spectroscopy?
A: First, there are already advanced and sophisticated techniques which can overcome some of the unavoidable limitations of Raman spectroscopy. Among these are surface-enhanced Raman spectroscopy (SERS), coherent anti-Stokes Raman scattering (CARS), and stimulated Raman scattering (SRS), all which have greatly improved “hardware” performance.
However, artificial intelligence (AI) and machine learning (ML) are having a major impact on the results provided by the data analysis, by enabling higher-performance automated analysis of complex data sets. AI algorithms can suppress noise, compensate for background signals, and identify subtle spectral patterns that would be difficult or impossible to detect otherwise.
Q: Finally, what is the relationship between Raman spectroscopy and infrared spectroscopy?
A: Infrared (IR) spectroscopy is a similar chemical analysis technique that analyzes molecular vibrations but in a different way. This technique is generally very good at identifying and quantifying the types of substances that Raman cannot analyze efficiently. Detailed discussion of IR spectroscopy is beyond the scope of this article, of course.
Conclusion
Raman scattering and associated spectroscopy provide a convenient way to assess material composition that is non-invasive, instantaneous, requires no sample preparation, and is harmless due to no need for no reagents or fluids. While the principle has been known for over 100 years, it is only in recent decades that advances in necessary electro-optical components have made it practical for use “in the field.” It is now a widely used approach to provide quick and accurate assessment of material quality and consistency, as well as in-package content, for food, pharmaceutical, and related product areas.
References
Raman Spectroscopy Overview, Agilent Technologies
Raman spectroscopy – Basic principle, instrumentation and selected applications for the characterization of drugs of abuse, Science Direct
Guide to Raman Spectroscopy, Bruker Corporation
Raman Spectroscopy, Wikipedia
Basic Principles of Raman Scattering and Spectroscopy, Edmund Optics Inc.
AI Opens Opportunities to Deploy Raman Spectroscopy, Photonics July 2026
Related EEWorld Online content
An Inexpensive and Flexible Micro-Raman System
What are next-generation bio sensing techniques? Part 1
What are next generation bio sensing techniques? Pt 2
What’s new in glucose sensing?
Smart Device Detects Food Contaminants in Real Time
Basics of spectrometers and spectroscopy