
A vector network analyzer enables you to conveniently measure S-parameters.
In this series, beginning in part 1 , we have looked at distributed impedance, transmission lines, characteristic impedance, and S-parameters. We noted that when we launch a signal into a transmission line with a characteristic impedance Z0 connected to a two-port network under test, all or some of the signal may reflect back to the source, be absorbed in the network under test, or pass through the network under test.
Q: How do we quantify these potential transmissions and reflections?
A: Figure 1 repeats a figure from part 3 with some nomenclature changes. Here, the subscript to the voltage wave v represents the port, while the plus sign as a superscript indicates a signal moving toward the network, and the minus sign as a subscript indicates a signal moving away from the network. Thus, v1+ is a voltage waveform incident on port 1, v1– is a voltage waveform moving away from port 1, and so on.
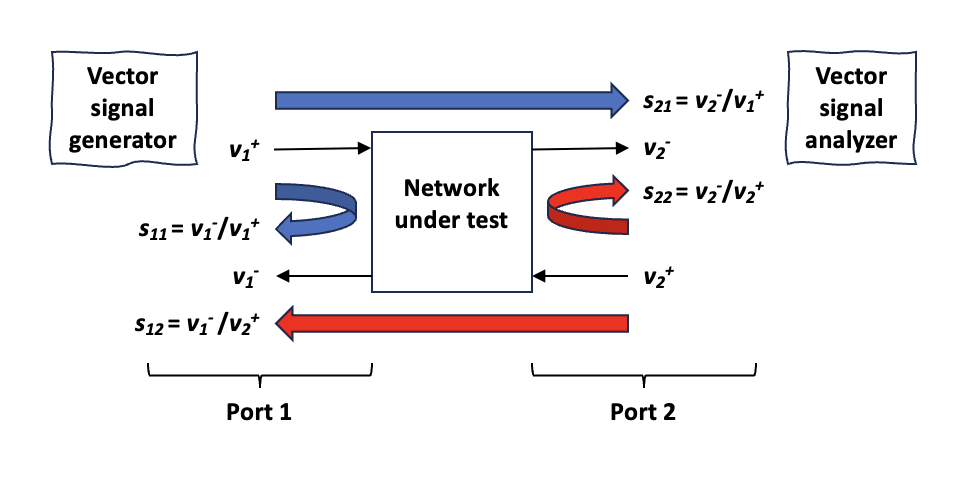
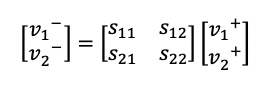
The equations in the figure show the s values for a single incident waveform on the network. For example, s11 equals v1– divided by v1+ when v2+ is zero. The following matrix shows the full relationship of S-parameters and the incident and transmitted or reflected voltage waves for a two-port network:
Q: How do we physically make the measurements?
A: I’ve penciled in one possibility, showing a vector signal generator on the left and a vector signal analyzer on the right. Both instruments are positioned to measure s21, which is v2– divided by v1+, essentially the forward gain of the network. We could then switch the generator and analyzer around to measure s12, but this approach is tedious and error-prone.
Q: What’s the alternative?
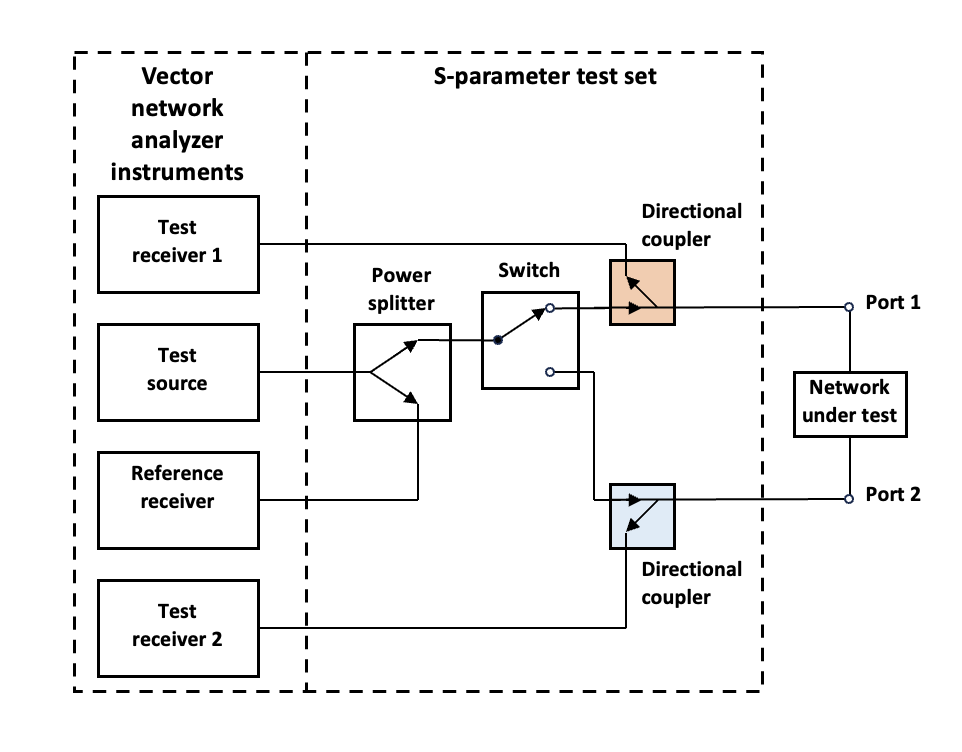
A: We can use a vector network analyzer (VNA) with an S-parameter test set, as shown in Figure 2. The VNA includes the necessary instruments. For a two-port application, a single source (vector signal generator) and two test receivers (vector signal analyzers) often suffice. The S-parameter test set includes switches and directional couplers that route the test signals to and from the network under test. The reference receiver confirms the source’s output magnitude and phase by way of the power splitter in the test set.
Q: What’s the role of the switch and couplers?
A: With the switch in the position shown in the figure, the switch directs the source’s output (representing v1+ in this case) to port 1 of the network under test. Receiver 1 can measure the reflected voltage v1– via the directional coupler highlighted in orange, and receiver 2 can measure the transmitted voltage v2– from port 2 via the directional coupler highlighted in blue, enabling calculation of s11 and s21.
Reversing the switch applies the source output (v2+ in this case) to port 2 of the network under test. Then, receiver 2 can measure the resulting reflected voltage waveform v2– by way of the blue-highlighted coupler, and receiver 1 can measure the transmitted voltage wave v1– via the orange-highlighted coupler. These results enable the calculation of s12 and s22, completing our S-parameter derivation for the two-port network.
Q: Could you show us an S-parameter matrix for a specific network under test?
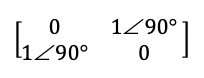
A: As a simple example, let’s assume that our network under test is a three-inch length of 50-W coaxial cable, our measurement system has a 50-W system impedance, and our operating frequency is 1 GHz. Because our measurement system and network under test both have 50-W impedances, there will be no reflections, so s11 and s22 will be zero. We can assume that our short cable is lossless, so the forward and reverse gain magnitudes will be 1. However, the wavelength at 1 GHz is about one foot, so our three-inch cable represents a quarter wavelength, and we can expect a 90° phase shift in either direction. We can therefore expect our S-parameter matrix to look like this:
Q: Can you briefly summarize what we’ve covered in this series?
A: Sure. In part 1, we looked at the limitations of the lumped impedance model and when we need to move to distributed impedance. In part 2, we looked at adapting a DC model to elucidate Heaviside’s telegrapher’s equations. In part 3, we looked at S-parameters, leading up to this conclusion in part 4 on how to measure them.
Related EEWorld Online content
What’s all this VNA calibration stuff?
Making sense of test circuits with Kirchhoff’s laws: part 3
Measuring signals on transmission lines
What are insertion loss and return loss and how can I measure them?
Should I use a spectrum, signal, or vector network analyzer? part 1
Understanding the basics: What is characteristic impedance?