
High impedances can degrade the integrity of power delivered to data-center power-distribution networks.
In part 1 of this series, we looked at ways to maximize data-center efficiency, and in part 2 we looked at relevant parameters from the grid connection to the input of a power-supply unit (PSU) or intermediate bus converter (IBC). In this concluding part, we will look at measurements from the PSU or IBC through the point-of-load voltage regulators (VRs) to the chips such as graphical processing units (GPUs) and other components.
Q: What are some of the key challenges?
A: Traditionally, data centers have included servers running diverse workloads, with power usage averaging out and power consumption remaining relatively constant overall. However, in AI data centers, GPUs are often synchronized, resulting in high power requirements when all GPUs are performing intense matrix math, followed by a relatively idle period during which communications occur. Consequently, power requirements fluctuate quickly and widely—for example, from 30% of rated load to 100% and back again.[1]
Q: What problems does that present?
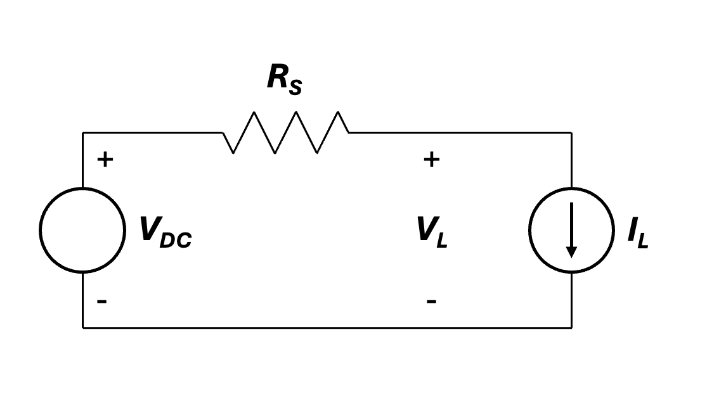
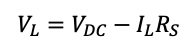
A: It can contribute to power-supply voltage ripple. As shown in Figure 1, a DC input voltage (VDC) drives a load modeled as a current source IL through a conductor loop with an impedance RS. The load voltage VL is simply the input voltage minus the drop across RS:
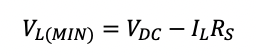
The load voltage will be at its minimum when load current is at its maximum:
And it will be at its maximum when load current is at its minimum—that is, rated load current minus the difference between full rated load current and the minimum operating load current:

Ripple is then the difference between the maximum load voltage and minimum load voltage:

We can now calculate allowable conductor impedance for a given ripple spec:
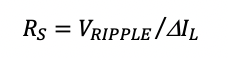
Let’s say, using round numbers as an example, VDC equals 1 V and 100% rated load current is 1,000 A, and our allowable ripple is 3%, or 0.03 V. For the previously mentioned 30% to 100% load variation, DIL is 700 A, and the maximum impedance is

Q: How can we double-check this result?
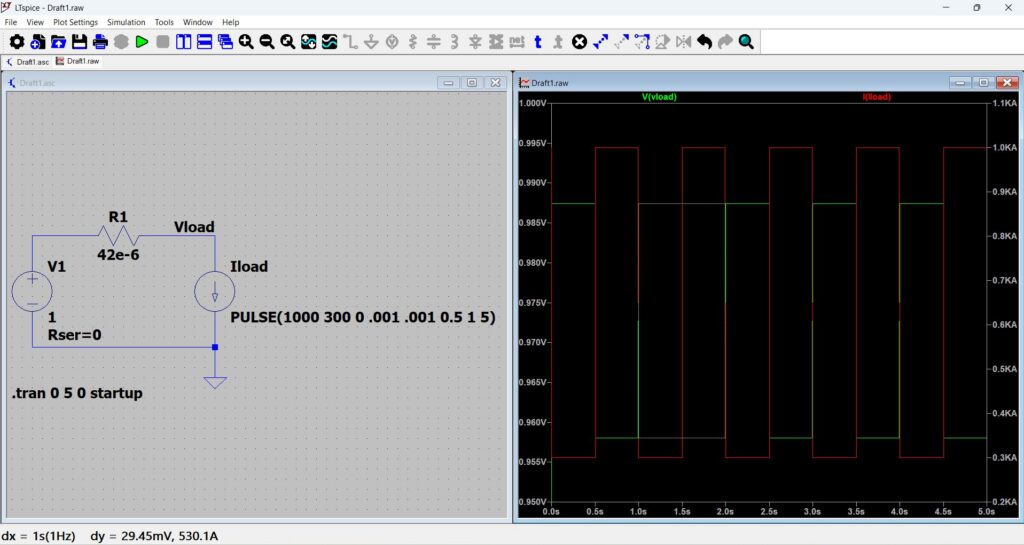
A: In the LTspice simulation in Figure 2, we can see on the right that the load current (red trace) varies between 300 and 1,000 A, and in response, the load voltage (blue trace) varies by 29.45 mV over each cycle, or just within our 3% margin. Keep in mind that these ripple load current variations and conductor resistance. There can be other sources of ripple as well. Also note that the actual load current will not be a nice clean square wave.
Q: I notice your simple circuit doesn’t have any capacitance or inductors.
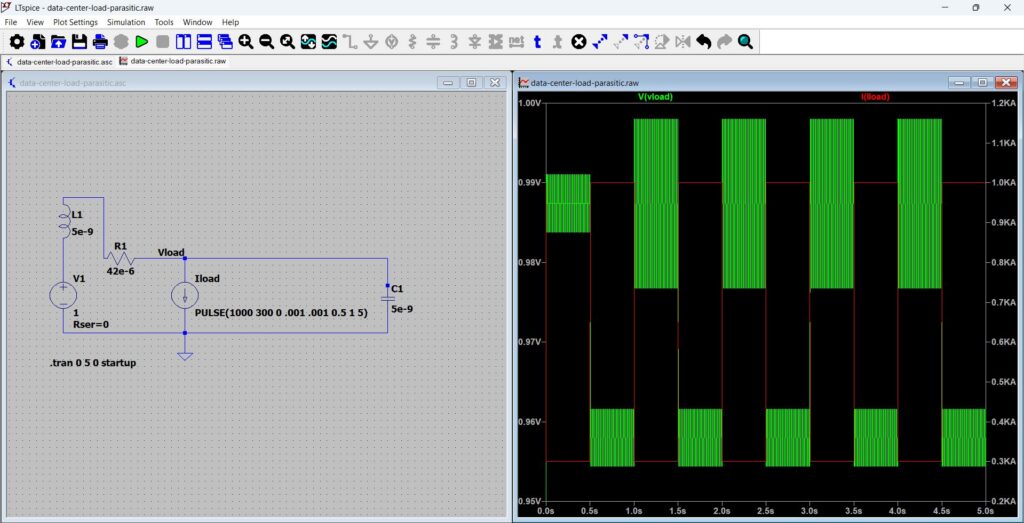
A: Right. In Figure 3, I’ve added a few nanohenries of series inductance and a few nanofarads of parallel capacitance to the simulation. As you can see on the right, the picture gets pretty ugly. So designers have to treat their power-distribution lines as transmission lines, as discussed in a previous series.
Q: What are some steps designers can take to minimize impedance?
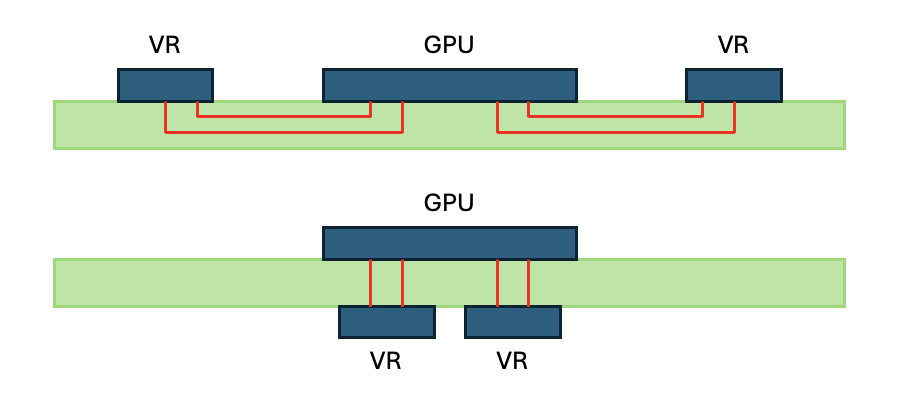
A: One approach is to move from a lateral to a vertical power-delivery approach, in which the VRs are located directly underneath the GPU, as shown in Figure 4, thus shortening the lead lengths and reducing both real and reactive impedance[2].
Q: What instruments are useful in testing chip-level power rails?
A: A vector network analyzer is useful in evaluating the power rails’ transmission-line parameters, such as s11, the reflection coefficient. An oscilloscope is useful for transient analysis, allowing you to compare simulation results with real-world measurements. Most manufacturers offer detailed application notes on applying their instruments to power-integrity measurement, and some offer power-integrity-analysis software that automates many measurement and data-collection tasks. Whatever instrument you choose, make sure to apply de-embedding, as described in an earlier series. De-embedding ensures that you are measuring the device or system under test, and not fixtures and probes in your test setup.
References
[1] 800 VDC Architecture for Next-Generation AI Infrastructure, Nvidia
[2] Vertical power delivery enables cutting-edge processing, Vicor
Related EEWorld online content
What is de-embedding and how do I perform it (part 1)?
Get the most from your oscilloscope: part 1
S-parameters and distributed impedance: part 1
How to measure PCB trace or power/return plane impedance
How physics relates signal integrity, power integrity, and EMC
Catching what you can’t see: Runt triggers and power integrity analysis