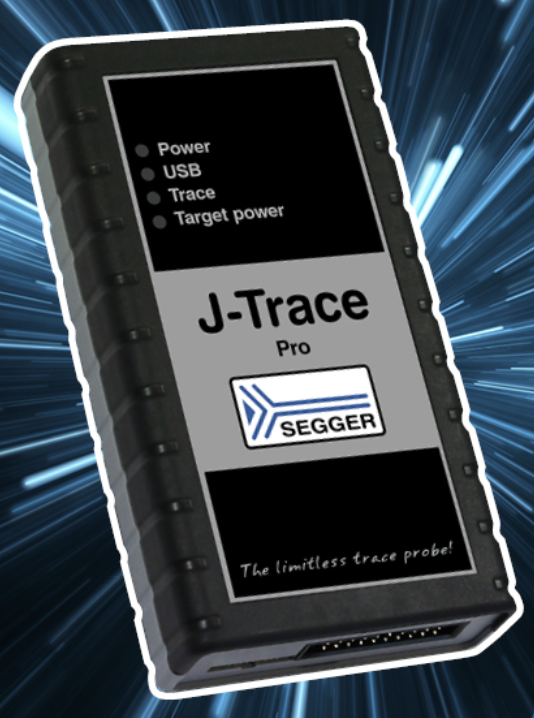
 The new flagship model J-Trace PRO is now the “all-in-one” probe for any popular CPU core and architecture. It combines all the debug capabilities of the market-leading J-Link series with all the analyzing, verifying, and code-profiling features of the J-Trace series to get a truly one-stop solution.
J-Trace PRO offers multi-platform support (RISC-V, Arm), up to 4 MB/s download speed, and comes with Ethernet and SuperSpeed USB 3.0 interfaces. It ships with every feature enabled, including Unlimited Flash Breakpoints and real-time analysis with the Ozone debugger and performance analyzer, at no additional cost.
The entire trace system is designed for ease of use. With just a few clicks, a full visualization of what the application is doing, and where most of the time is spent, is rapidly made available.
The J-Trace PRO captures complete instruction traces and performs unlimited profiling and code coverage over unlimited periods of time, enabling the recording of infrequent, hard-to-reproduce bugs. This is particularly helpful when the program flow ‘runs off the rails’ and stops in a fault state. Features include streaming trace, Live Code Profiling (providing visibility as to which instructions have been executed and how often, so hotspots can be addressed and optimization opportunities identified), and Live Code Coverage (so engineers have visibility over which parts of the application code have been executed).


