When it comes to amplification, the principal parameters are gain and fidelity of the output relative to the input. Gain, denoted by β (Greek letter beta), is the ratio of output voltage, current or power to input. An amplifier by definition has a power gain greater than one.

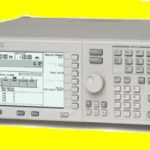
The MG3700A Vector Signal Generator has the ability to generate a variety of modulation waveforms as used in modern communication standards.
Measurements that characterize amplifier gain serve as good examples of how an instrument called an arbitrary waveform-based vector signal generator can be useful. As the name implies, the instrument is basically a combination of an arb waveform generator and a vector network analyzer. It has a niche because modern modulation schemes often have two modulating signals, I and Q. Ordinarily, it would take two signal generators to generate the modulated signals: the arb generator for I and Q and a digital signal generator for the signal being modulated. One problem: There is a delay in the I and Q signal of an ARB waveform generator. The modulation accuracy drops without delay compensation, and external factors can make the delay vary slightly from one day to the next. Moreover, IQ signals generated by an external generator are more susceptible to noise than if IQ modulation was internal.
The arb waveform-based vector signal generator eliminates the noise and modulation accuracy problems by virtue of building the two waveform generators into the same chassis. Besides simplifying IQ-modulated waveform generation, the instrument can be helpful for amplifier measurements involving multiple waveforms.
First consider a few of the basic amplifier measurements. A two-port operating power gain is:
Gp = Pload/Pinput
where Gp is the operating power gain; Pload is the maximum power delivered to the load, averaged over time; and Pinput is the time-averaged power at the network input.
Gain is generally expressed in dB. Amplifier gain is most commonly specified as a minimum value over a specified frequency range. Some amplifiers specify both minimum and maximum gain, to ensure that subsequent stages in a system are not under or over driven.
Small-signal gain is the gain in the amplifier’s linear region of operation. Gain flatness is the measure of how gain varies over a specified frequency range. It is typically measured by putting a constant power source at the amplifier input and sweeping its frequency over the appropriate range. Variations in the flatness of amplifier gain can distort signals the amplifier passes. When using a vector network analyzer, gain is called S21 in S-parameter terminology.
The frequency response is the dominant error in a small-signal gain and flatness measurement setup. Deviations in gain over the bandwidth of interest will distort transmitted signals because frequency components won’t be amplified equally. In measuring gain, it is assumed that both input and output impedances of the amplifier are the same as the characteristic impedance of the system. This assumption is particularly important when measuring the qualities of amplifiers operating at RF frequencies.
The amplifier may also respond very differently at various temperatures. The tests should be done when the amplifier is at the desired operating temperature. The frequency-response effects and mismatches of the attenuators and couplers must be accounted for during calibration since they are part of the test system. Proper error-correction techniques can reduce these effects.
When multiple frequencies appear on the amplifier input, nonlinearities in an amplifier can introduce third-order intermodulation distortion (IMD) to the output. The traditional two-tone (f1 and f2) IMD test produces third-order products that arise at frequencies of 2f1 – f2 and 2f2 – f1. The typical two-tone IMD test setup uses two signal generators with the signals summed in a two-way combiner and then fed into the amplifier under test. A spectrum analyzer performs the actual measurement.
Isolators are typically also necessary to keep signal energy from one source leaking through the power combiner and into the other source. The signal from one generator at the output of a second generator will cause its output level to modulate and create IMD.
An arb waveform-based vector signal generator will greatly simplify this test setup–no isolators, no combiner. Prior to measuring the DUT, the usual practice is to verify the IMD created by the generators is 20 to 30 dB below the DUT specification. Because the test setup and spectrum analyzer-generated distortion components happen at the same frequencies as the distortion components to be measured, there is no way of knowing the phase relationship between the test system and DUT signals.
To measure the instrumentation IMD, connect the two-tone source directly to the load and measure the IMD of the source over all required power levels and frequencies. Doing the same procedure with the DUT inserted should then give the IMD arising from amplifier distortion.
A point to note is the maximum power the vector signal generator can deliver while maintaining linear performance. On the Rhode & Schwarz MG3700A arb waveform generator-based vector signal generators, that level is +10 dBm with a mechanical attenuator option. The maximum available power must be reduced by the signal peak/average ratio of the composite signal. The ratio is equal to: 10 log(NumberOfTones). For example, a two-tone signal has a peak/average ratio of 3 dB; a 16-tone signal provides a maximum ratio of 12 dB.
The output power of a power amplifier cannot increase indefinitely. Gain compression is the output power level where the gain drops 1 dB from its small signal gain. It also is sometimes desirable to measure the saturated power capability of an amplifier. The saturation point is the point where any rise in input power does not produce a corresponding rise in output power. Some VNAs have canned routines that automatically place a marker at the 1-dB compression point and return the gain and input power.
Another point to note is that pulsed amplifiers, as used in radar, can’t be excited with a continuous wave signal for compression testing. Applying a CW signal can overheat and damage the amplifier. Instead, the compression test must use a pulsed signal source.