Ordinary oscilloscopes can view basic parameters in modern motor drives, but operational insights generally require specialized power analyzers.
Variable frequency drives (VFD) generate carefully controlled pulse-width modulated (PWM) waveforms to modulate the speed of industrial ac motors. Often, the motors involved are three phase.

Three-phase ac induction motors (ACIMs) are widely used though they are less efficient than brushless dc motors (BLDC) and permanent magnet synchronous motors (PMSM). Each of these motor systems requires its own special drive, but all of them use PWM to vary the frequency and voltage delivered to the motor. The modulation on these PWM waveforms is complex, making it challenging to get stable oscilloscope measurements to diagnose problems.
Use of PWM motor drives has been accelerated by the perfection of vector control methods which allow dc motors to be controlled with the precision and reliability of ac motors. These advances let BLDCs and PMSMs replace brushed dc motors and induction motors not only in industrial applications but also in power tools, appliances, and electric vehicles.

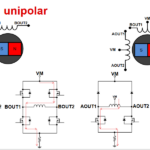
PWM drives can be powered by dc, single-phase ac, or three-phase ac. But three-phase supplies are common in industrial equipment. The three-phase supply is rectified and filtered to produce a dc bus which powers an inverter section inside the drive. The inverter consists of three pairs of semiconductor switches (MOSFETs, GTOs, IGBTs, and increasingly SiC power transistors) with associated diodes. Each pair of switches powers one phase of the motor. This is the basic architecture, but the control electronics varies in terms of feedback and complexity. Nevertheless, there are a few general categories of PWM drives.
The six-step/trapezoidal drive generally powers BLDC motors. In contrast, scalar drives typically handle induction motors. The term scalar is used to contrast this method with vector control, also called field-oriented control (FOC), where the stator currents of a three-phase ac or BLDC motor are identified as two orthogonal components visualized with a vector.
In contrast, scalar control simply changes the fundamental frequency of the PWM waveform driving the motor. To maintain full torque, the control system in the drive maintains the ratio between the output voltage and PWM fundamental frequency.
Control electronics generate three low-frequency sinewaves 120° apart which modulate the width of the pulses for each pair of switches. The average voltage presented to the motor winding is basically sinusoidal. The other two phases of the motor winding have similar average voltages spaced 120° apart.
In scalar control, the motor appears as an inductor to the output voltages of the inverter. Because an inductor has a higher impedance to higher frequencies, most of the current drawn by the motor is from the lower frequency components in the PWM waveform. This results in the current drawn by the motor being approximately sinusoidal in shape. By controlling the amplitude and frequency of the modulating waveforms, and controlling the V/Hz ratio, PWM drives supply three-phase power to drive the motor at a required speed.

Advanced drives for induction motors and synchronous motors employ vector drive techniques. These drives are more flexible and efficient than scalar drives, but also more complex. Like scalar drives, vector drives power the motor with sinusoidal current. The vectors, D and Q, are orthogonal and have magnitudes related to the motor torque and magnetic flux. The controller uses what’s called the Clarke and Park transform to calculate the magnitudes of D and Q and then uses these values as setpoints for the control loop.
The control system measures the position of the rotor to synchronize the system. Rotor sensing typically employs Hall sensors or a quadrature encoder interface (QEI). But there are also sensorless systems where the control system uses the back-emf of the motor to determine rotor position.
Scope connections
VFD measurements make use of both voltage and current probes. Motor drives involve relatively high voltages. For example, the dc bus voltage in a 480-Vac three-phase motor drive is typically around 680 Vdc. Most scope probes aren’t rated for voltages this high.
Common-mode voltages can also be relatively high. That is, measurements are often “floating” relative to ground, so ground-referenced probes may be dangerous. It is important to verify signals are not floating more than the probe’s common-mode voltage rating. Most VFD frequencies of interest are 200 MHz or less, a factor to keep in mind when considering probe bandwidth. For these reasons, scope makers generally recommend high-voltage differential probes for general-purpose use in VFD measurements.
A point to note is that ground-referenced passive probes should not be used to measure phase-to-neutral voltages. The neutral terminal on a power feed is probably not at ground potential. So significant currents will flow through the probe and oscilloscope earth ground. The result can be shock or damage to the DUT or scope.
Before any power measurements, current probes must be degaussed, and all probes should be de-skewed. Residual magnetization can throw off measurements. Degaussing removes any residual magnetization from the probe’s magnetic core. The degaussing procedure typically commences with just a button press.
The de-skewing process corrects for differing propagation delays arising between any two scope channels as can be introduced by probes and probe cabling. De-skewing is important because phase relationships are critical for many of the measurements on VFD systems. The basic procedure is to put a synchronized signal on all channels and make adjustments to equalize the delays in individual channels. Scope makers such as Tektronix offer special de-skewing fixtures to simplify the process.

Though three-phase VFDs are perhaps the most common type, commercial, residential, or automotive drive systems may be powered by single-phase ac or dc. In addition, three-phase systems can be wired and modeled in two ways: star (or wye) and delta connections. The wiring configuration determines the calculations for the power analysis. These configurations apply to both the inputs and outputs of motor drives.
There are two kinds of single-phase VFD connections. The most straightforward is the single-phase two-wire connection. Two scope channels, one for voltage and the other for current, are necessary. Single-phase ac and dc systems use the same setup.
The second type of single-phase VFD connection is single-phase three-wire. It is rare in industrial uses but sometimes arises in North American residential applications where one 240-V and two 120-V supplies are available and may have different loads on each leg. VFD measurements require a four-channel scope, two voltage channels and two current channels. The total power measured is VxI (Load1 + Load2).
We now turn to measuring three-phase connections with four scope channels, two for voltage and two for current. The output of a three-phase VFD is typically three wires. Motor drive inputs are more likely to use a four-wire system. When three wires connect the source to the load, test setups use one of the wires as the reference phase. Then the scope is set up to measure voltage between the reference phase and each of the other two. And a current measurement is made on each of the two non-reference connections. The load and source can be wired in delta or star configurations but there must not be a neutral conductor between them. In this situation two current and voltage readings will account for the total power being delivered to the load.
Though only two power readings–one on each non-reference phase–are necessary to measure the total power in a three-wire system, there are advantages to using three. The setup requires six oscilloscope channels: three for voltages and three for currents. This configuration provides individual phase-to-neutral voltages and the power in each individual phase, something not possible when using one of the connections as a reference.
Although there is no physical neutral in this system, it is possible to determine the instantaneous line-to-neutral voltages from the instantaneous line-to-line voltages. The line-to-neutral voltage for a given line is just the difference between the voltage measured to each of the other two lines, divided by three.
The resulting point-by-point conversion expresses all voltages relative to a single reference and corrects the phase relationships between voltage and current for each phase. This conversion also allows instantaneous power calculations–total true power supplied to the load is just the sum of the line-to-neutral voltage multiplied by the current in the line for each of the three lines.
That brings us to the case where there are three phase connections to the load along with a neutral connection. Here, measurements take place via six scope channels, three for current and three for voltage. Line voltages are all measured relative to the neutral. Phase-to-phase voltages can be calculated from the phase-to-neutral voltage amplitudes and phases using vector mathematics. The total power is the sum of the power measured for each of the three phases.
Phasors
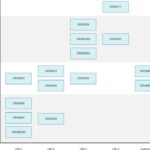
Of course, the three sinusoidal ac voltages and currents in a three-phase motor drive all have the identical frequency. Having six or more waveforms plotted on the same time axis makes it difficult to discern magnitudes and phase angles. That’s why phasor diagrams representing the magnitude and directional relationship between two or more vectors are widely used in three-phase power system analysis.

It’s complicated to set up a three-phase phasor diagram on ordinary scopes, but instruments targeting power quality measurements have phasor-diagram software built in.
Perhaps the most complicated part of the measurement procedure is in orienting the three or more clamp-on current probes normally used in power quality measurements—they must be connected so arrows on the inductive head point toward the load. Motor loads are inductive, so the voltage vector on the phasor diagram should lead the current vector. If the current vector leads, the current clamp is probably reversed.
In a balanced three-phase system, with identical loads on each phase, each of the three voltage vectors nominally sit 120º apart from each other. Ditto for the current vectors. In this balanced system the sum of the line currents is zero at any instant; the same for the sum of the line-to-line voltages. But real systems have differences in load impedances among the three phases that result in imbalances. The resulting phasor diagram contains vectors of different lengths and different angles between voltage and current vectors.
The phasor diagram is helpful for seeing the impact of inductive or capacitive loads. Phasors for pure resistive loads have in-phase voltage and current, meaning there is no lag between voltage and current. Motors are inductive in nature, so the current vector always lags the corresponding voltage vector. Motor drive designers strive to minimize the phase angle between voltage and current phasors.
Clarke and Park DQZ (direct quadrature zero) transforms are commonly used in field-oriented control of three-phase ac machines. The Clarke transform converts the time domain components of a three-phase system to two components in an orthogonal stationary frame. Within the control system, these transformations are used to convert the three-phase voltages being applied a motor to orthogonal D and Q vectors. Basically, the DQZ transformation rotates the reference frame of a three-element vector to simplify the analysis. These simplified vectors can easily be scaled and integrated to maintain a desired speed. Reverse transforms may then be used to create the drive signals for PWM in the inverter.
The D and Q vectors generally can’t be directly measured because they typically reside within a digital signal processing block such as an FPGA. But power analysis instrumentation often contains software that can derive measurements of D and Q based on the three-phase output voltage or current. This capacity enables helps gauge the effect of control system adjustments.
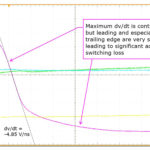
The output waveform of a PWM drive is a complicated mixture of high-frequency components related to the carrier and components at lower frequency related to the fundamental frequency driving the motor.
Setting up a trigger for scope measurements on PWM waveforms can be challenging because the waveform is modulated at low frequency. Measurements such as total rms voltage, total power and so forth must take place at high frequency but over an integral number of cycles of the low frequency component in the output waveform.
Consequently, specialized power analyzers often contain facilities for simplifying these measurements. In the case of Tektronix instruments, for example, software demodulates the PWM waveform on a channel specified as an “edge qualifier” and extracts the envelope as what’s called a math channel.