• Skip to primary navigation
  • Skip to main content
  • Skip to primary sidebar
  • Skip to footer

Electrical Engineering News and Products

Electronics Engineering Resources, Articles, Forums, Tear Down Videos and Technical Electronics How-To's

  • Products / Components
    • Analog ICs
    • Battery Power
    • Connectors
    • Microcontrollers
    • Power Electronics
    • Sensors
    • Test and Measurement
    • Wire / Cable
  • Applications
    • 5G
    • Automotive/Transportation
    • EV Engineering
    • Industrial
    • IoT
    • Medical
    • Telecommunications
    • Wearables
    • Wireless
  • Learn
    • eBooks / Handbooks
    • EE Training Days
    • Tutorials
    • Learning Center
    • Tech Toolboxes
    • Webinars & Digital Events
  • Resources
    • White Papers
    • Design Guide Library
    • Digital Issues
    • Engineering Diversity & Inclusion
    • LEAP Awards
    • Podcasts
    • DesignFast
  • Videos
    • EE Videos and Interviews
    • Teardown Videos
  • EE Forums
    • EDABoard.com
    • Electro-Tech-Online.com
  • Bill’s Blogs
  • Advertise
  • Subscribe

Why does the Fourier transform provide apparently inaccurate results, and what can I do about it? Part 4

February 14, 2024 By Rick Nelson

The FFT can measure phase angle, but what appears to be a meaningful result might just be the arctangent of a ratio of rounding errors.

Throughout this series, we reviewed the fast Fourier transform (FFT) as implemented in Microsoft Excel and investigated windowing functions. In this final part, we’ll cover phase measurements, but first, let’s look back at part 3, which we concluded by studying a signal for which windowing had no effect.

Why didn’t windowing help?

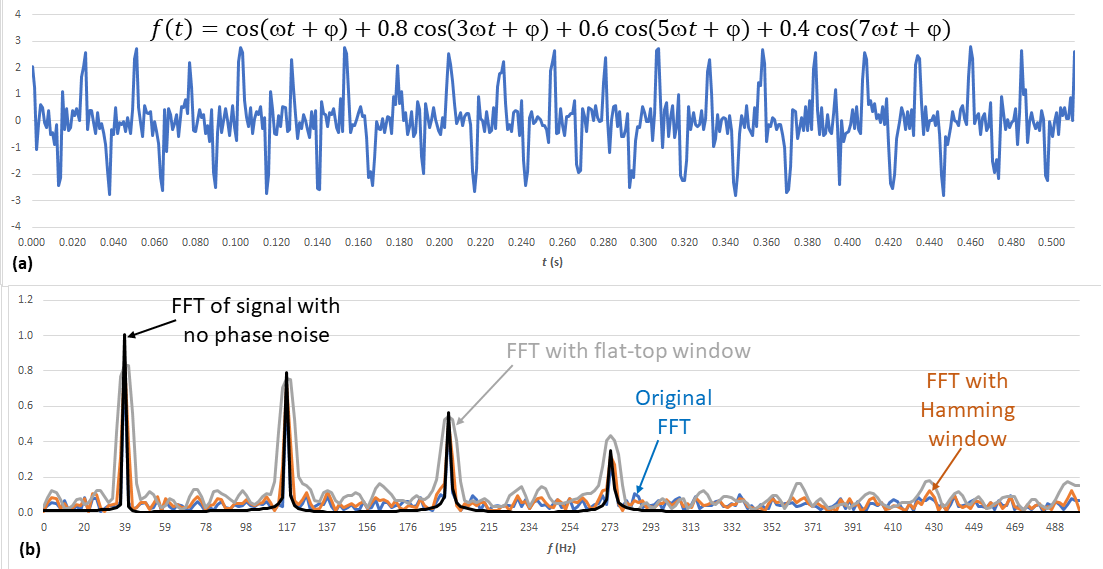
Figure 1a shows the original time-domain signal and the equation that defines it, where ω= 2π(39.1 Hz) and φ represents phase noise. To calculate φ, I used this Excel equation:

φ = -0.5+RAND()

RAND returns a random value between 0 and 1, so the expression returns a random value between -0.5 and +0.5, representing 1-radian peak-to-peak random phase noise. Figure 1b repeats Figure 8 from Part 3 but adds a transform (black trace) of the signal without phase noise, which has the expected amplitudes. The problem was not a spectral leakage problem that windowing could solve but rather an actual signal impairment in the form of phase noise.

Figure 1. A sample signal (a) yields the black FFT trace (b) when j = 0.

Can the FFT measure the phase noise?

The Excel FFT is not a great tool for that, which can be addressed using techniques discussed in an earlier series on phase noise (see part 1 and part 2). But the FFT can measure phase angle: the arctangent of the ratio of the imaginary to real parts of the complex FFT.

That seems easy.

Be careful. Consider the blue vector in Figure 2. The phase angle θ is the arctangent of 0.75/0.5  = 1.5, and you can use the Excel ATAN() function to correctly find θ= 56.3°. But try the same approach for the orange vector. Your answer will be -56.3° (the red vector) instead of the expected 123.7°.
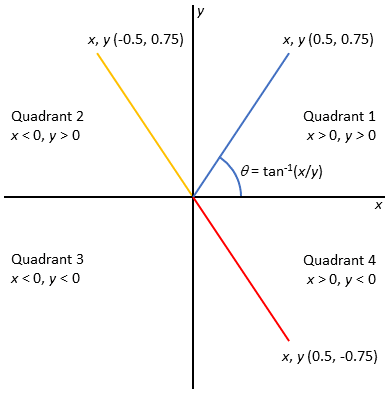
Figure 2. Keep track of quadrants when calculating q.

What causes that?

Once you calculate the ratio, you’ve stripped out information about how x and y individually contribute to the quotient’s polarity. For example, 0.75/-0.5 (quadrant 2) and -0.75/0.5 (quadrant 4) both equal -1.5 and ATAN() defaults to quadrant 4. To compensate, we could add some conditional programming steps: “If x < 0  and y > 0, then quadrant 2,” for example. Fortunately, Excel includes the ATAN2(x,y) function, which does that for us.

How do we modify our spreadsheet to calculate phase?

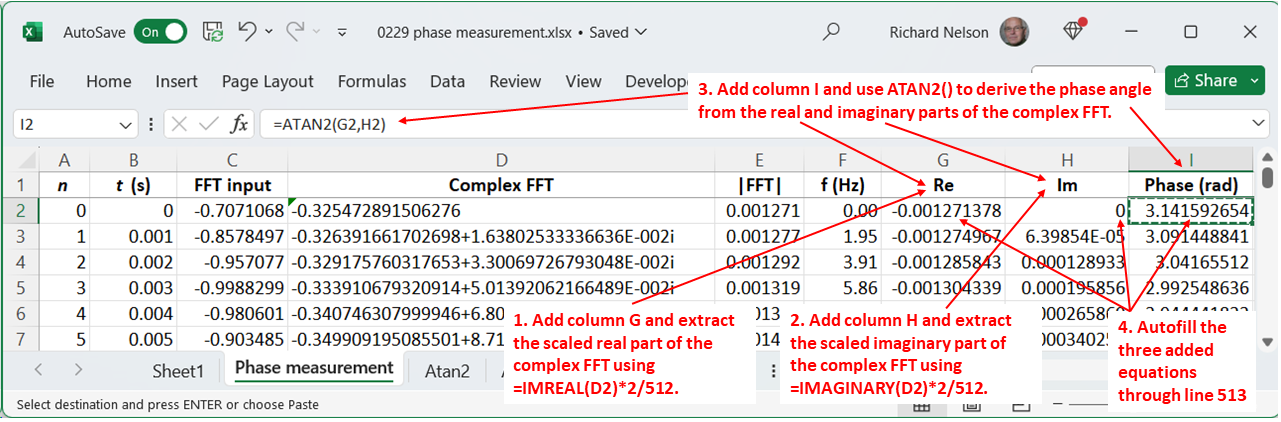
To add phase calculation to the Figure 4 spreadsheet in part 2, follow the steps in red in Figure 3.

Figure 3. Follow the steps in red to add phase calculation to the FFT.

Applying the Figure 4a sample waveform as the FFT input, we plot the Figure 4b FFT magnitude and phase — with the latter about 2.42 radians, or 139°, at 39.1 Hz.

Figure 4. The FFT of a sample waveform (a) result in an amplitude and phase plot (b).

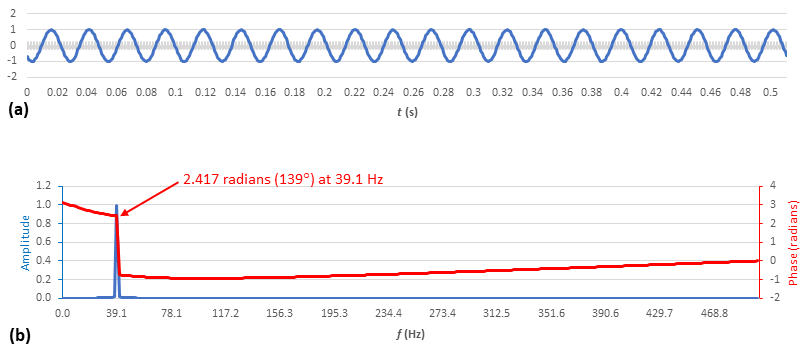
Woah! I can buy 139° at 39.1 Hz. But what is going on with the rest of that phase plot?

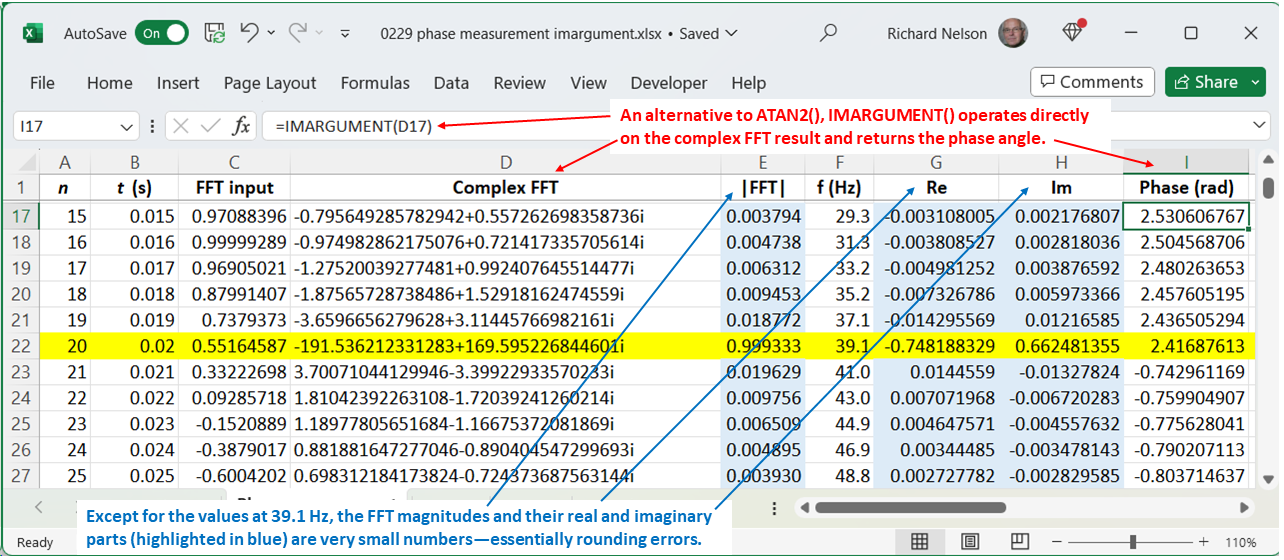
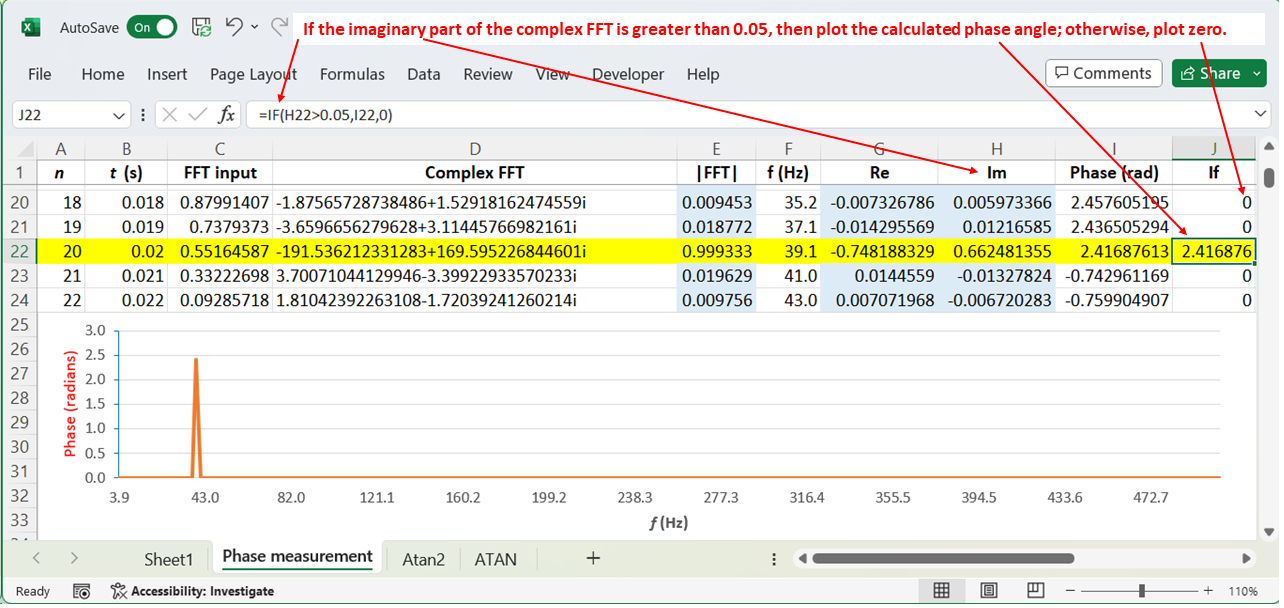
Let’s take another look at the spreadsheet and scroll down to 39.1 Hz (highlighted in yellow in Figure 5). At any other frequency, the real and imaginary parts of the complex FFT should be zero, and the FFT would return a divide-by-zero error. However, the numbers (highlighted in blue) are small but not zero. We are essentially taking the arctangents of ratios of rounding errors and getting meaningless results.

Figure 5. Except for the values at 39.1 Hz (yellow), the FFT’s magnitude and real and imaginary parts are very small numbers (blue).

A way to “clean up” the plot is to use an IF statement to plot zeros when the imaginary part falls below a certain threshold (Figure 6). Of course, the phase is not zero. Phase requires periodic changes in magnitude, and if those are not present (for example, any DC level, including zero), phase has no meaning.

Figure 6. An IF statement plots invalid phase calculations as zero.

Also, notice a change I made in Figure 5. In column I, I replaced ATAN2() with IMARGUMENT(), which directly operates on a complex number and calculates the phase angle without the need to extract the real and imaginary parts.

Could you review what we’ve covered in this series?

Sure. In part 1, we reviewed the discrete Fourier transform and began setting up an Excel spreadsheet to run the FFT. In part 2, we completed the spreadsheet and ran an FFT on a signal resembling Figure 1b. In part 3, we investigated spectral leakage and windowing, and here, in part 4, we looked at phase.

What’s a key takeaway?

Excel presents an interesting way of learning about the FFT, but your best bet for professional work is commercial engineering software or the FFT tool that comes with your oscilloscope. Let me also refer you to NumPy, a Python-based open-source project for scientific computing. It offers several FFT and other transform algorithms for further exploration.

You Might Also Like

Filed Under: FAQ, Featured, Test and Measurement Tips Tagged With: FAQ

Primary Sidebar

EE Engineering Training Days

engineering

Featured Contributions

GaN reliability milestones break through the silicon ceiling

From extreme to mainstream: how industrial connectors are evolving to meet today’s harsh demands

The case for vehicle 48 V power systems

Fire prevention through the Internet

Beyond the drivetrain: sensor innovation in automotive

More Featured Contributions

EE Tech Toolbox

“ee
Tech Toolbox: Internet of Things
Explore practical strategies for minimizing attack surfaces, managing memory efficiently, and securing firmware. Download now to ensure your IoT implementations remain secure, efficient, and future-ready.

EE Learning Center

EE Learning Center
“ee
EXPAND YOUR KNOWLEDGE AND STAY CONNECTED
Get the latest info on technologies, tools and strategies for EE professionals.
“bills

R&D World Podcasts

R&D 100 Episode 10
See More >

Sponsored Content

Advanced Embedded Systems Debug with Jitter and Real-Time Eye Analysis

Connectors Enabling the Evolution of AR/VR/MR Devices

Award-Winning Thermal Management for 5G Designs

Making Rugged and Reliable Connections

Omron’s systematic approach to a better PCB connector

Looking for an Excellent Resource on RF & Microwave Power Measurements? Read This eBook

More Sponsored Content >>

RSS Current EDABoard.com discussions

  • Core loss in output inductor of 500W Two Transistor forward?
  • Question LCD LED IPS display
  • Colpitts oscillator
  • BiSS-C Behavior Without Slave (dsPIC33AK128MC106 + iC-MB4)
  • GanFet power switch starts burning after 20 sec

RSS Current Electro-Tech-Online.com Discussions

  • Component tracks and pins are empty in proteus 8 (void)
  • An Update On Tarrifs
  • Need Help Figuring Out the Schematics Of Circuit Board
  • Wish to buy Battery, Charger and Buck converter for 12V , 2A router
  • applying solder paste from a jar
Search Millions of Parts from Thousands of Suppliers.

Search Now!
design fast globle

Footer

EE World Online

EE WORLD ONLINE NETWORK

  • 5G Technology World
  • Analog IC Tips
  • Battery Power Tips
  • Connector Tips
  • DesignFast
  • EDABoard Forums
  • Electro-Tech-Online Forums
  • Engineer's Garage
  • EV Engineering
  • Microcontroller Tips
  • Power Electronic Tips
  • Sensor Tips
  • Test and Measurement Tips

EE WORLD ONLINE

  • Subscribe to our newsletter
  • Teardown Videos
  • Advertise with us
  • Contact us
  • About Us

Copyright © 2025 · WTWH Media LLC and its licensors. All rights reserved.
The material on this site may not be reproduced, distributed, transmitted, cached or otherwise used, except with the prior written permission of WTWH Media.

Privacy Policy